
The Daily Drip
Core markets charts updates and commentary
Note: The counts on the right edge are real-time, and they are prone to adjustments as price action develops. Elliott Wave has a fluid approach, is evidence-based, and requires constant monitoring of certain thresholds.
In the counts below, this (( )) = circle on chart
SP500
It was a no-bid day since we started trading. A lower gap and weakness throughout the day. One of the worst weeks of the year seasonally lives up to its hype. What does this mean?
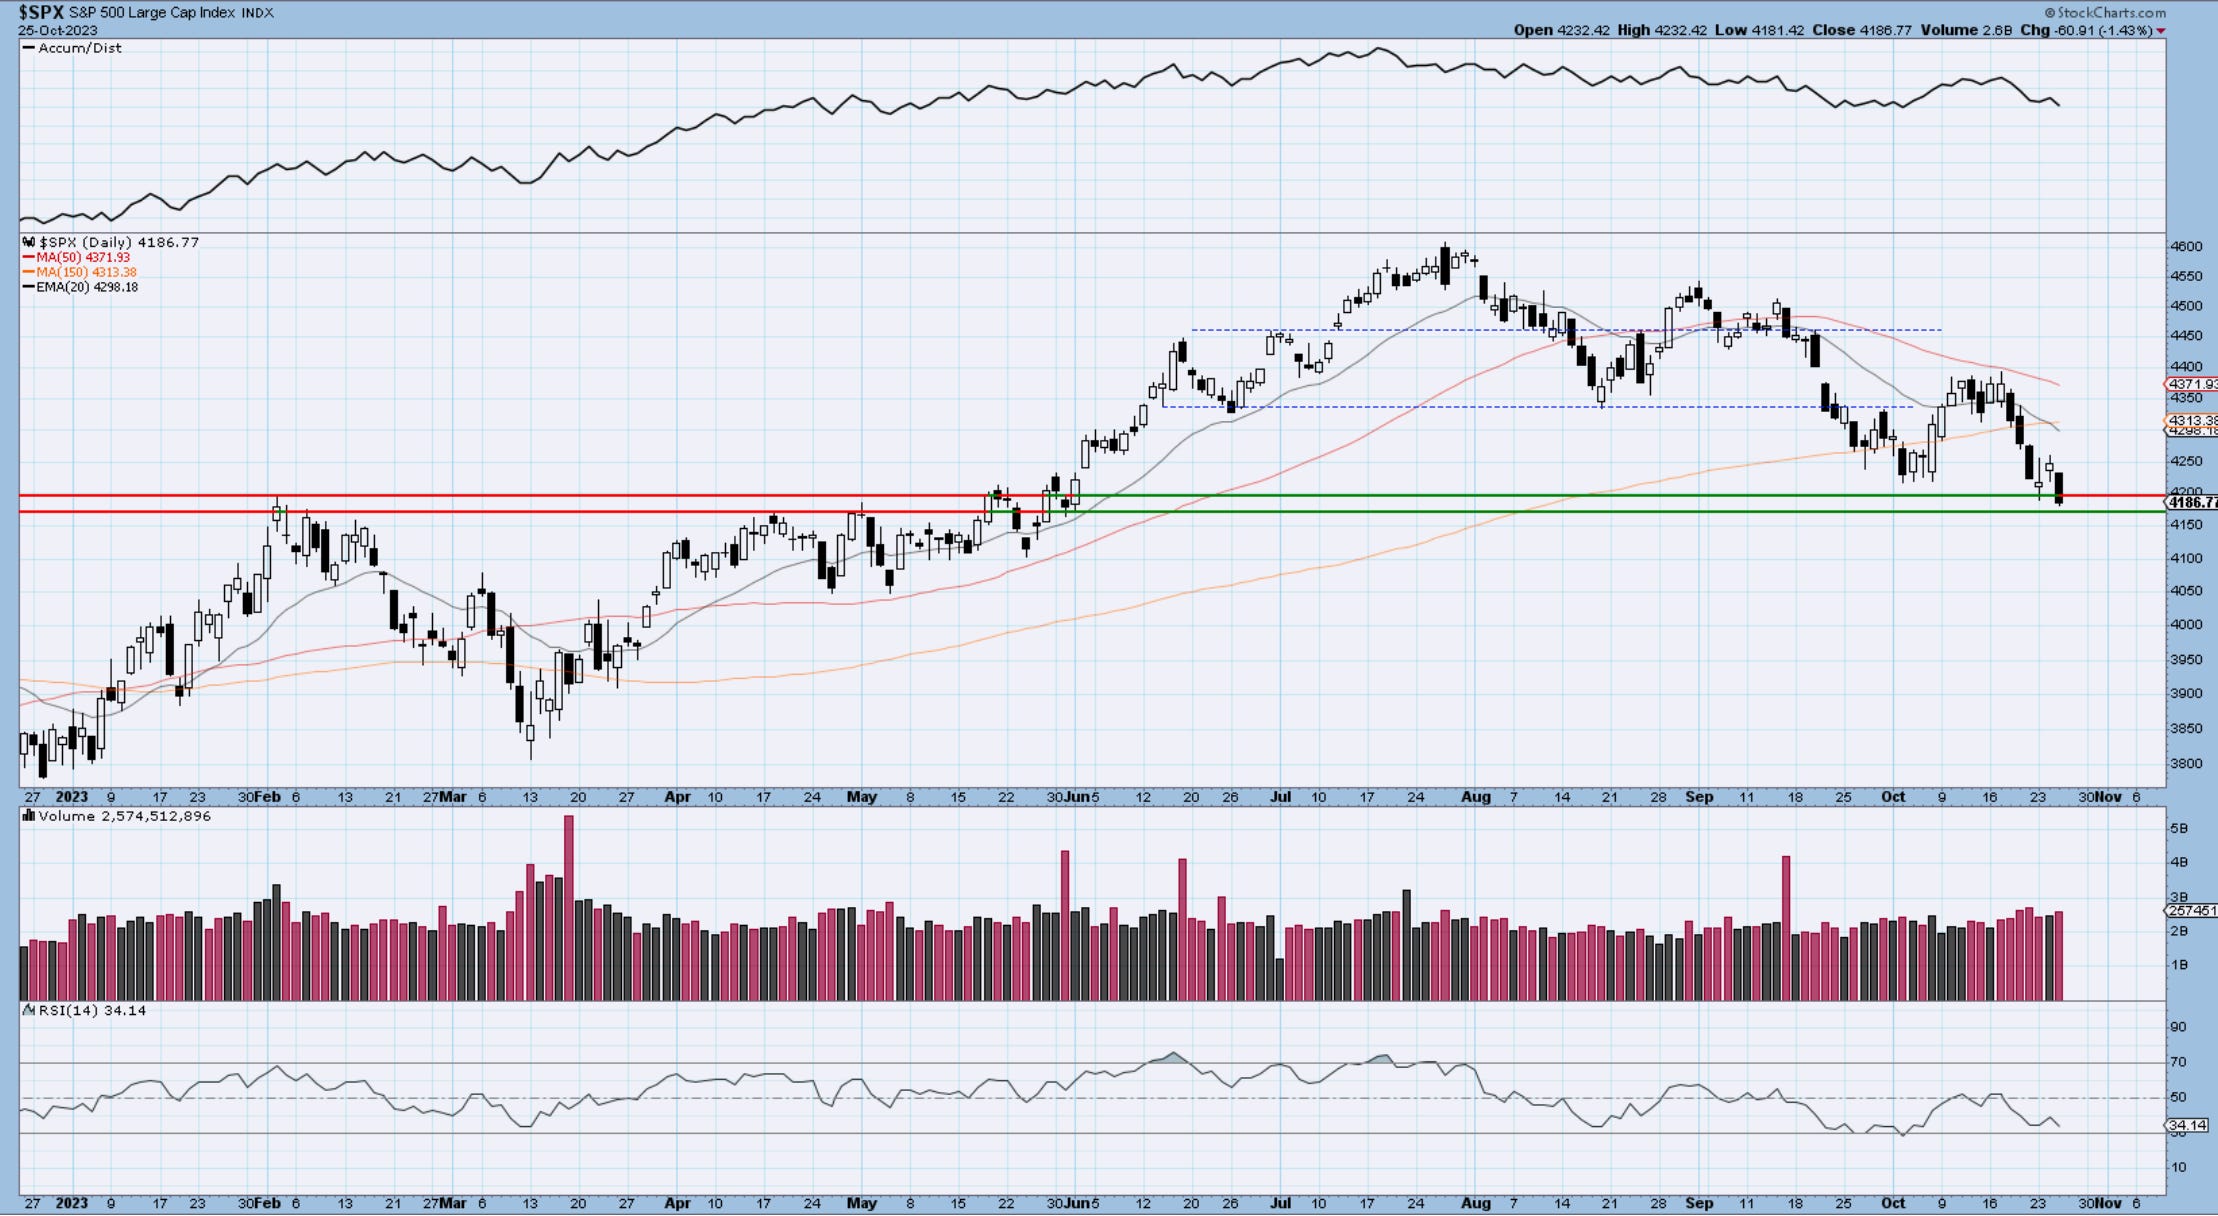
Well, the chart below displays the sp500 on a closing daily basis. While you hear about the 4200 level being broken as very important, if you look below you will see actually the closing prices from Feb 2nd and April 30th as the level the market targeted today. That’s 4180-85. The window for a bounce is approaching if not already here.
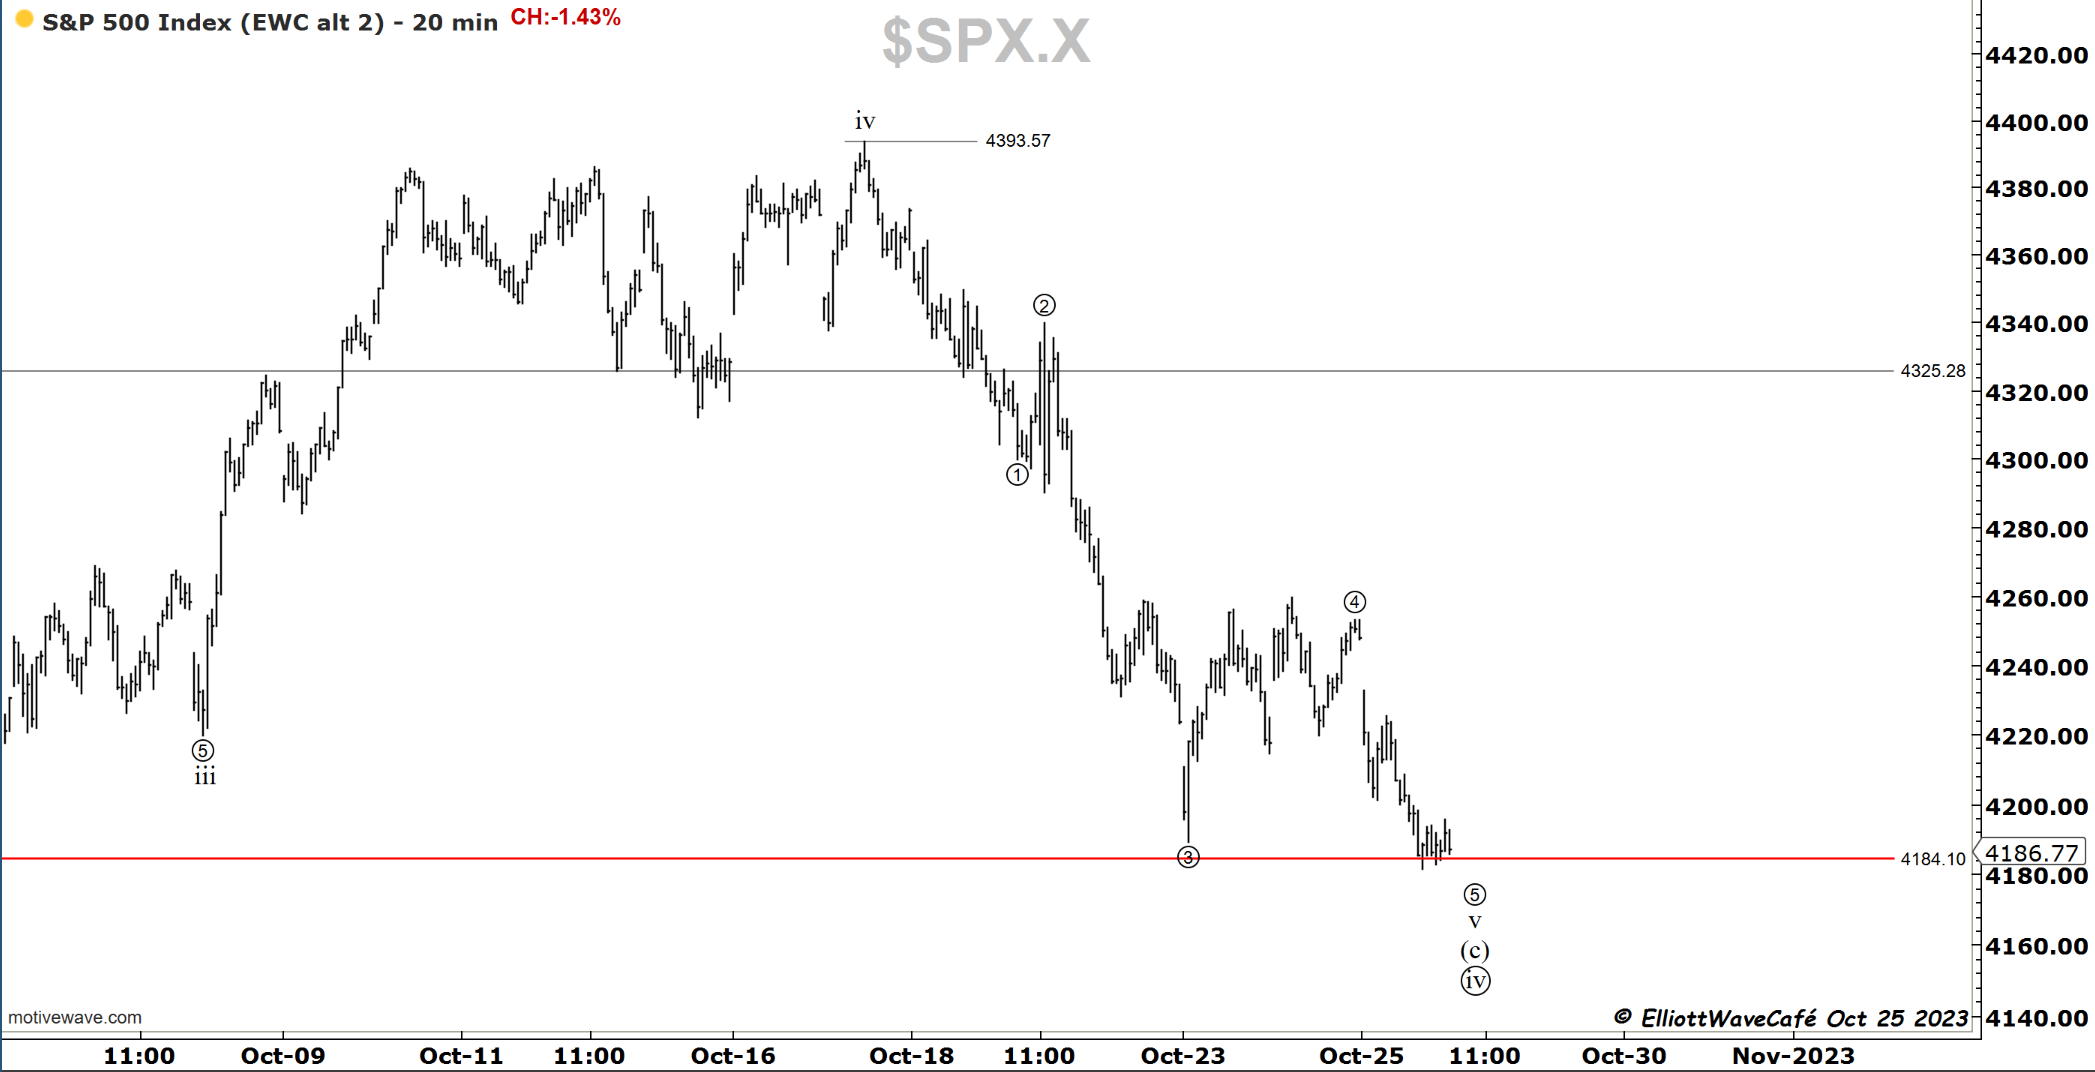
Here is a 20-minute chart of the index and the 5waves display. We could get a bit more selling tomorrow but it will be probably short-lived followed by a recovery back toward 4260 into next week. There is an unfilled gap up there as well.
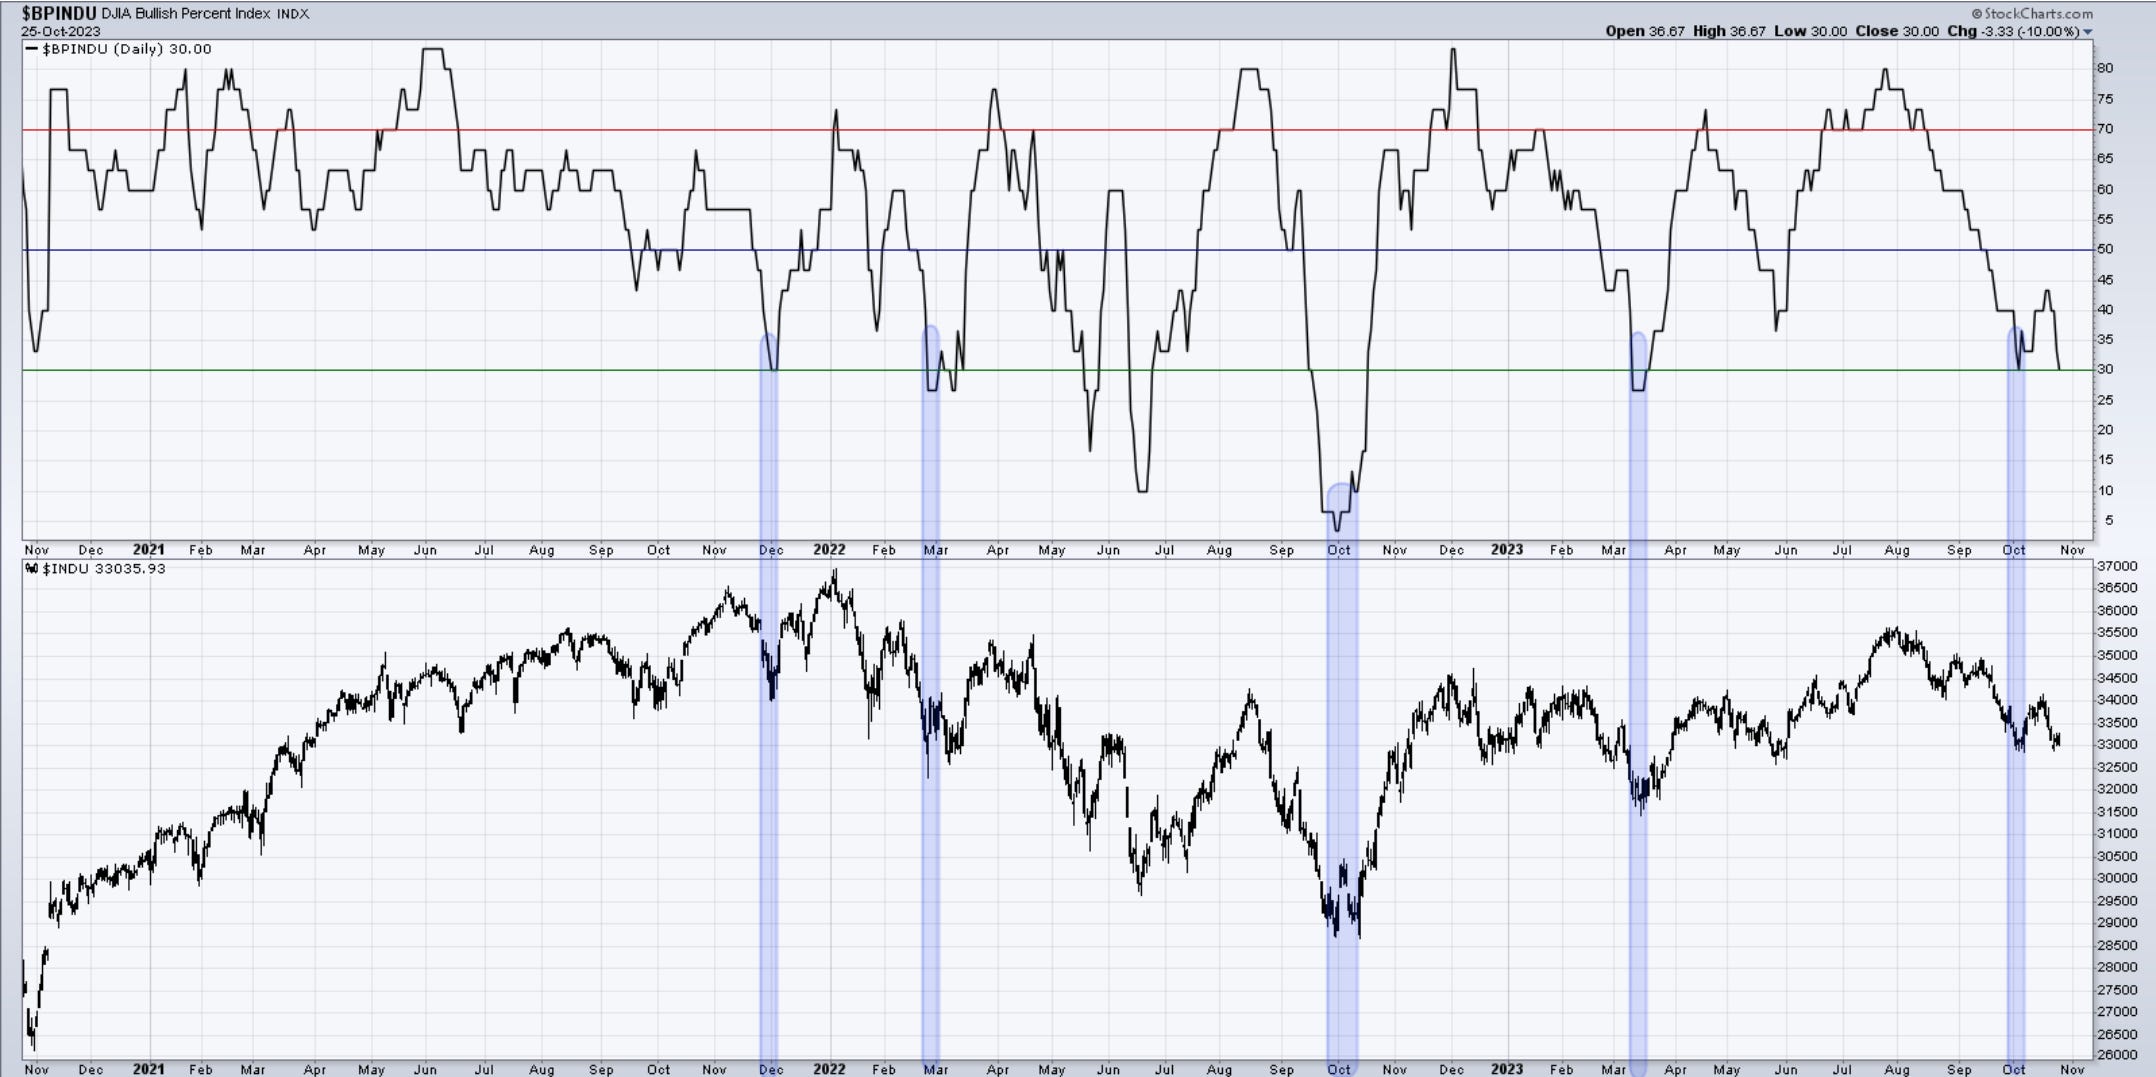
The BPI is back in the Hot Zone after the first 2 weeks of the month bounce. It pays to be careful about overstaying the welcome of short positions when this indicator is down here.
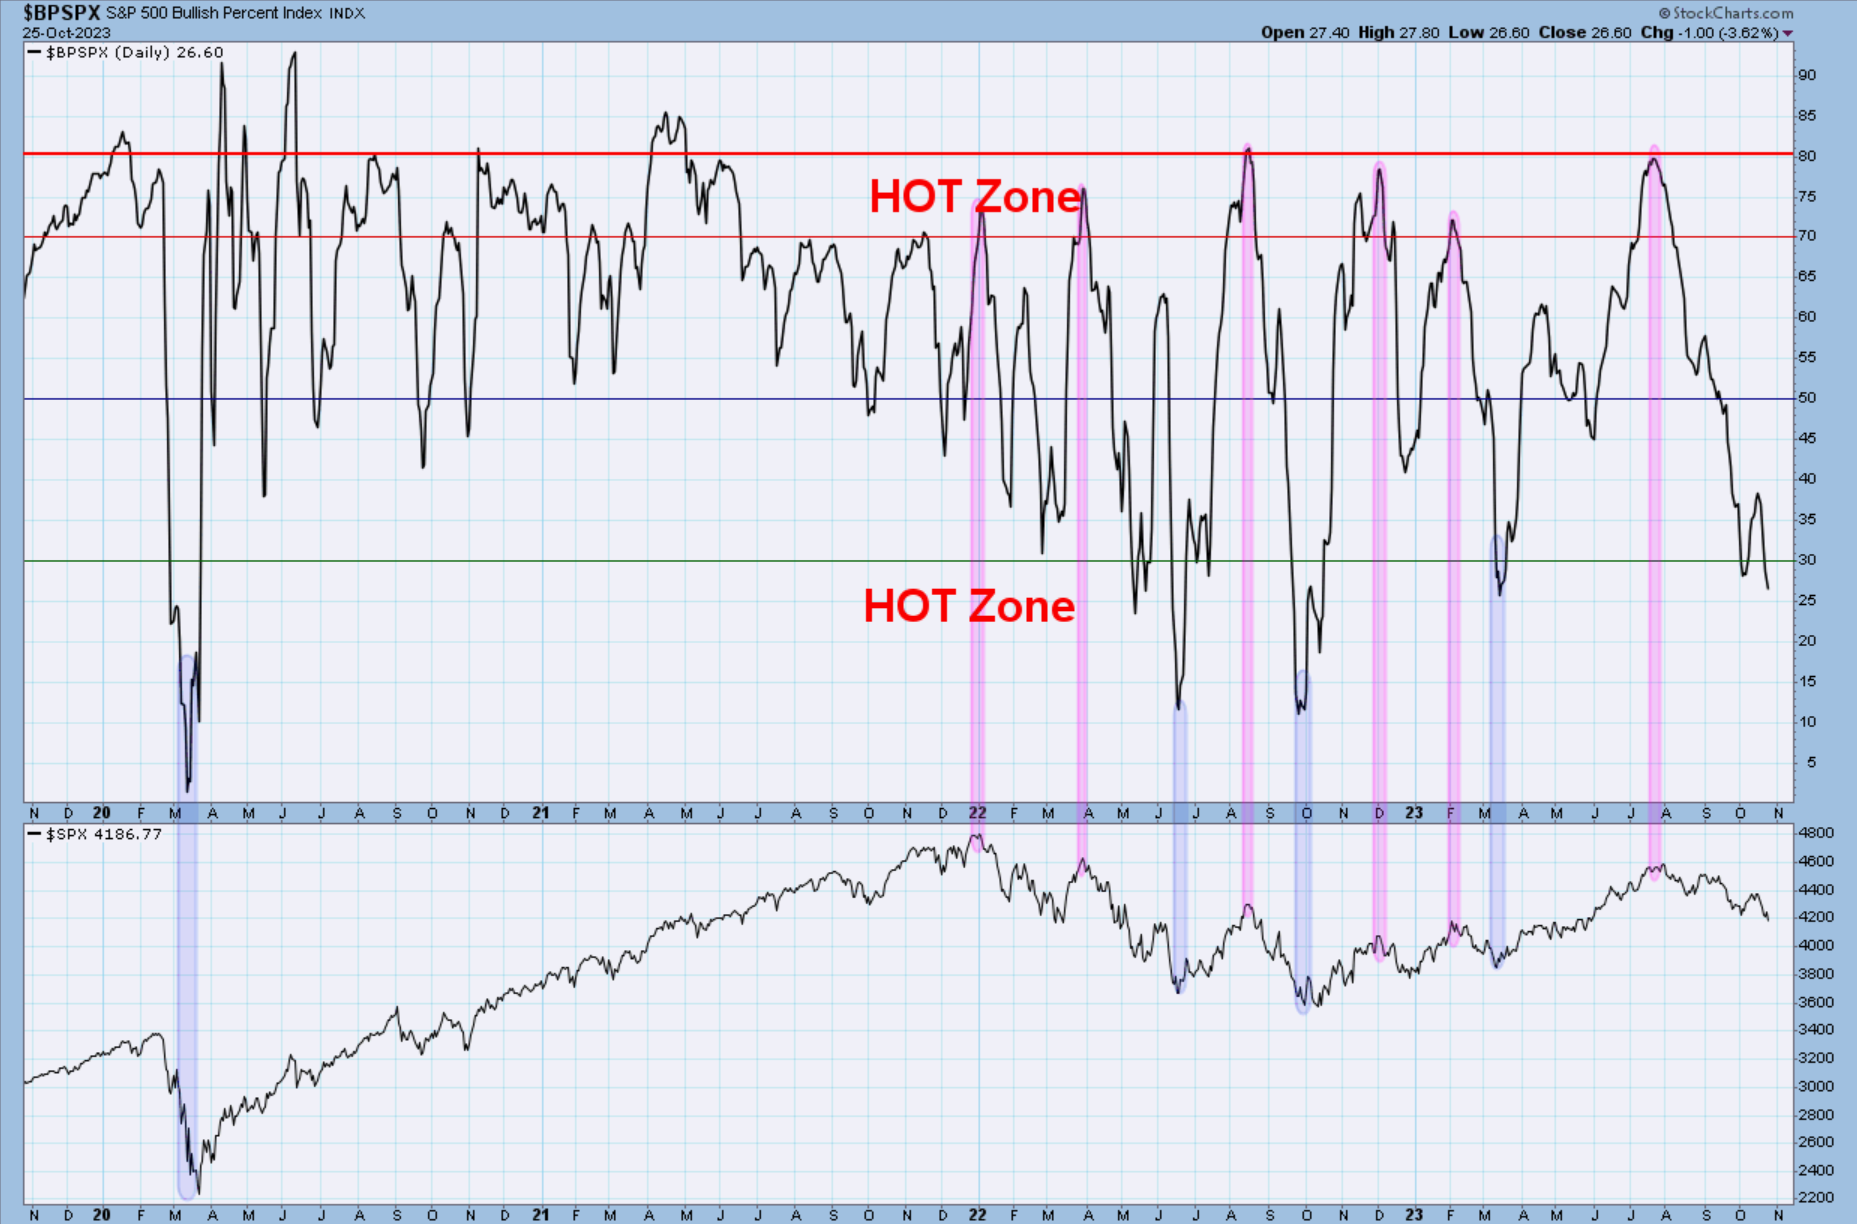
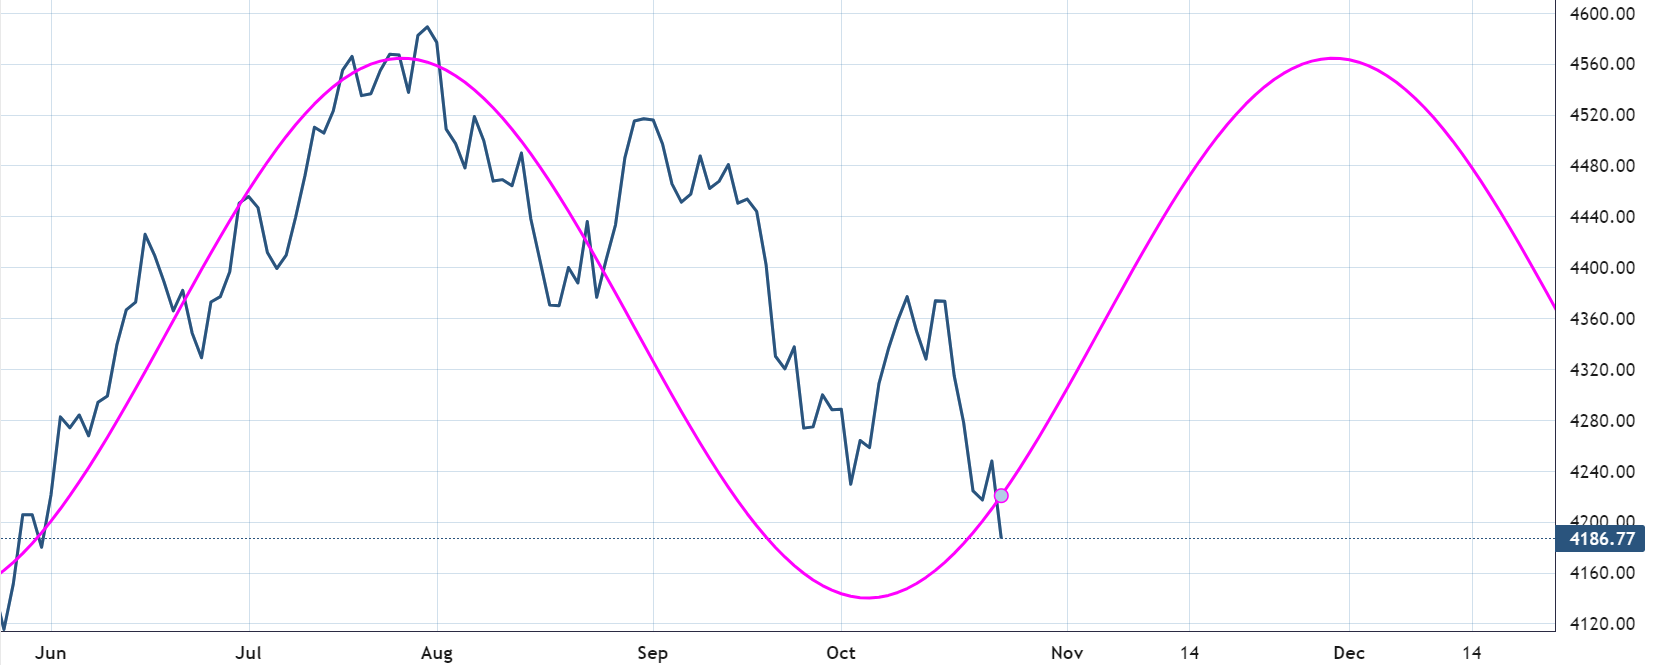
It can become quite consensus and very easy to feel bearish with the market acting like this for the past week or so. The bearish case is most compelling at the lows as well. The levels and counts presented suggest that it is quite late to take a strong bearish stance at this time. We are entering a strong seasonal period and while not a guarantee, one must incorporate that in the overall research. The cycle work I watch suggests a similar view bullish view into December. I will discuss the weekly cycles which are bullish into 2025 at a later date.
Nasdaq100
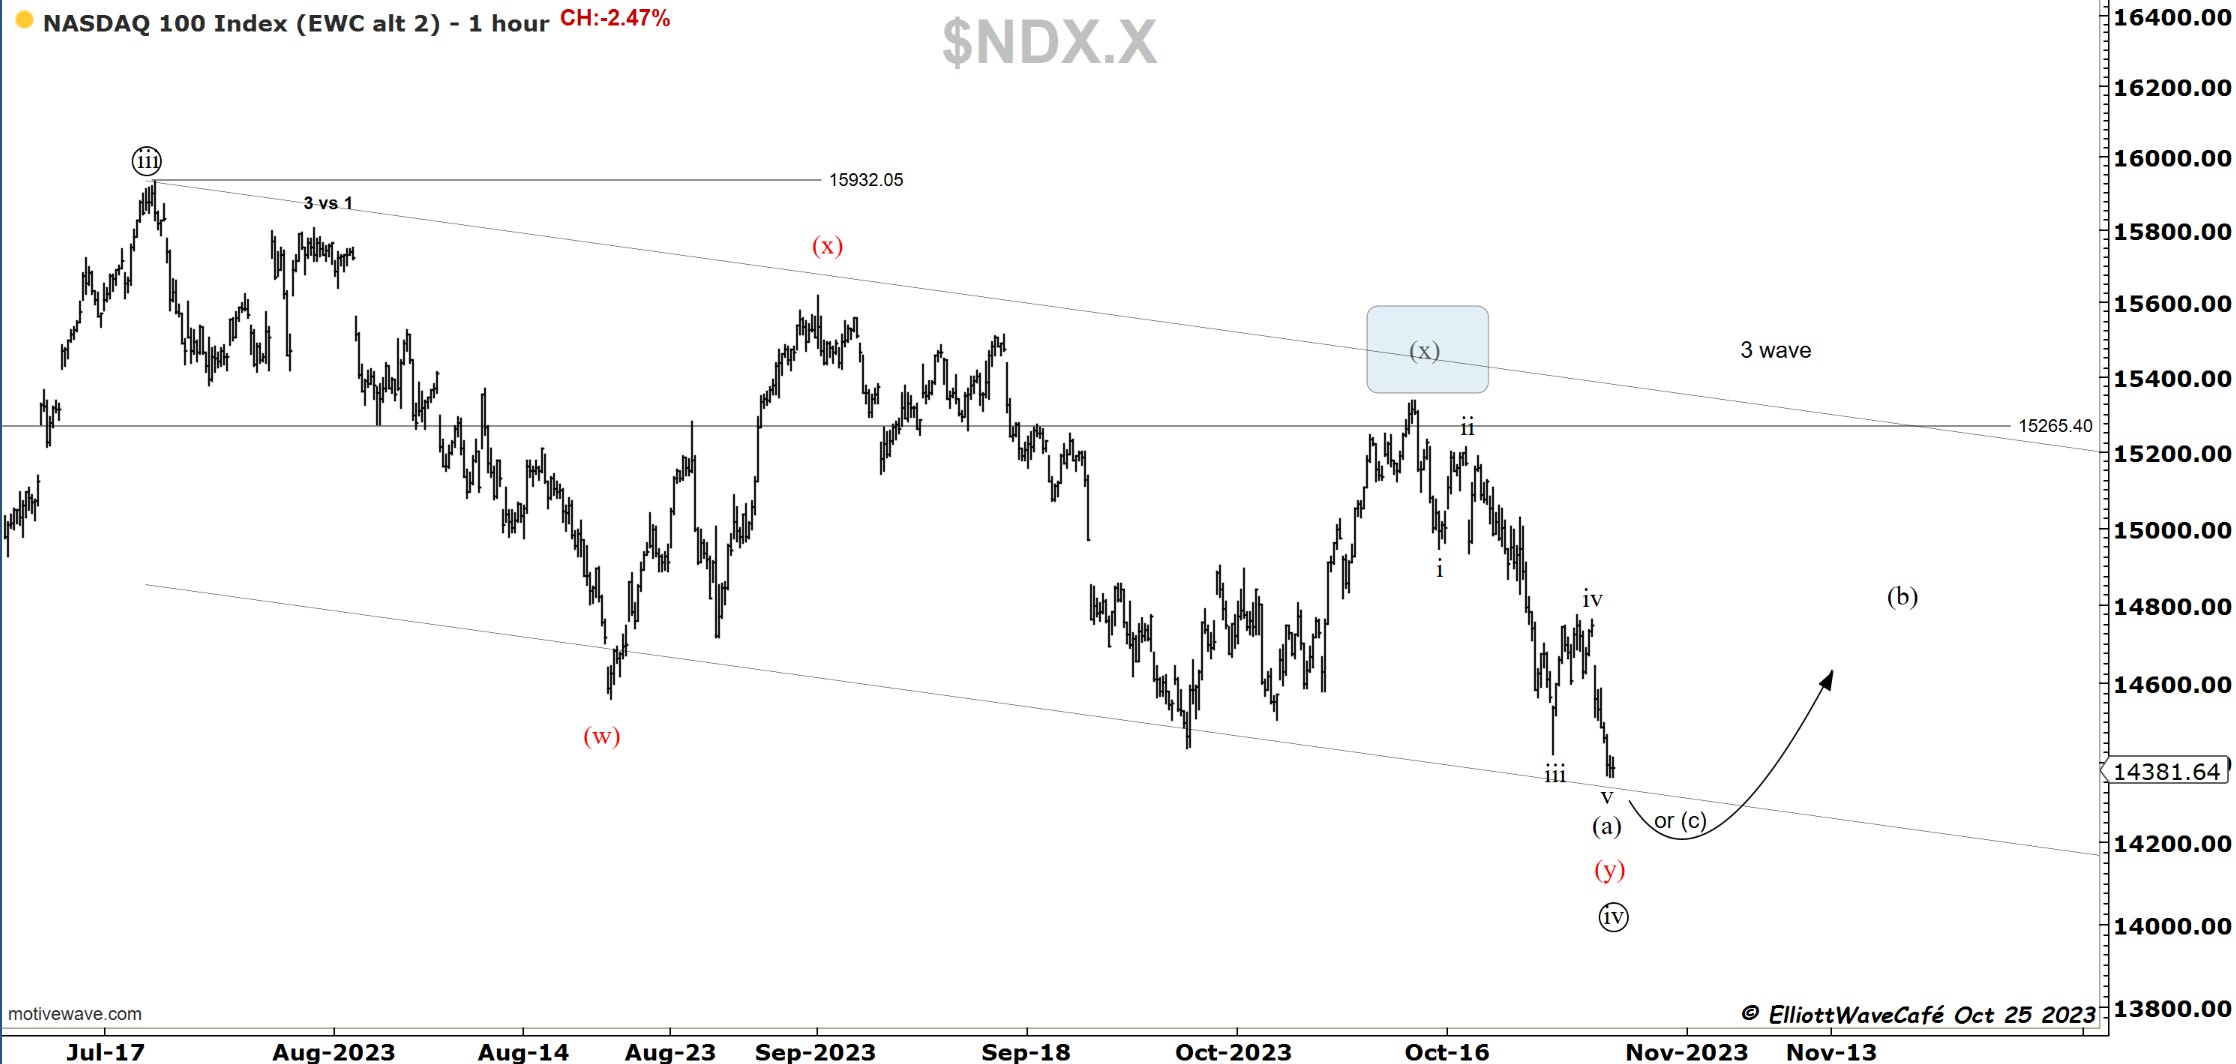
Nasdaq took a big hit today with a -2.47% decline. It is wave v of either wave (a) of (z) or (c) of (y). Bottom line, a bounce is expected next in either wave (b) or wave 1 of the next leg higher in ((v)) towards ATH.
RUSSELL 2000
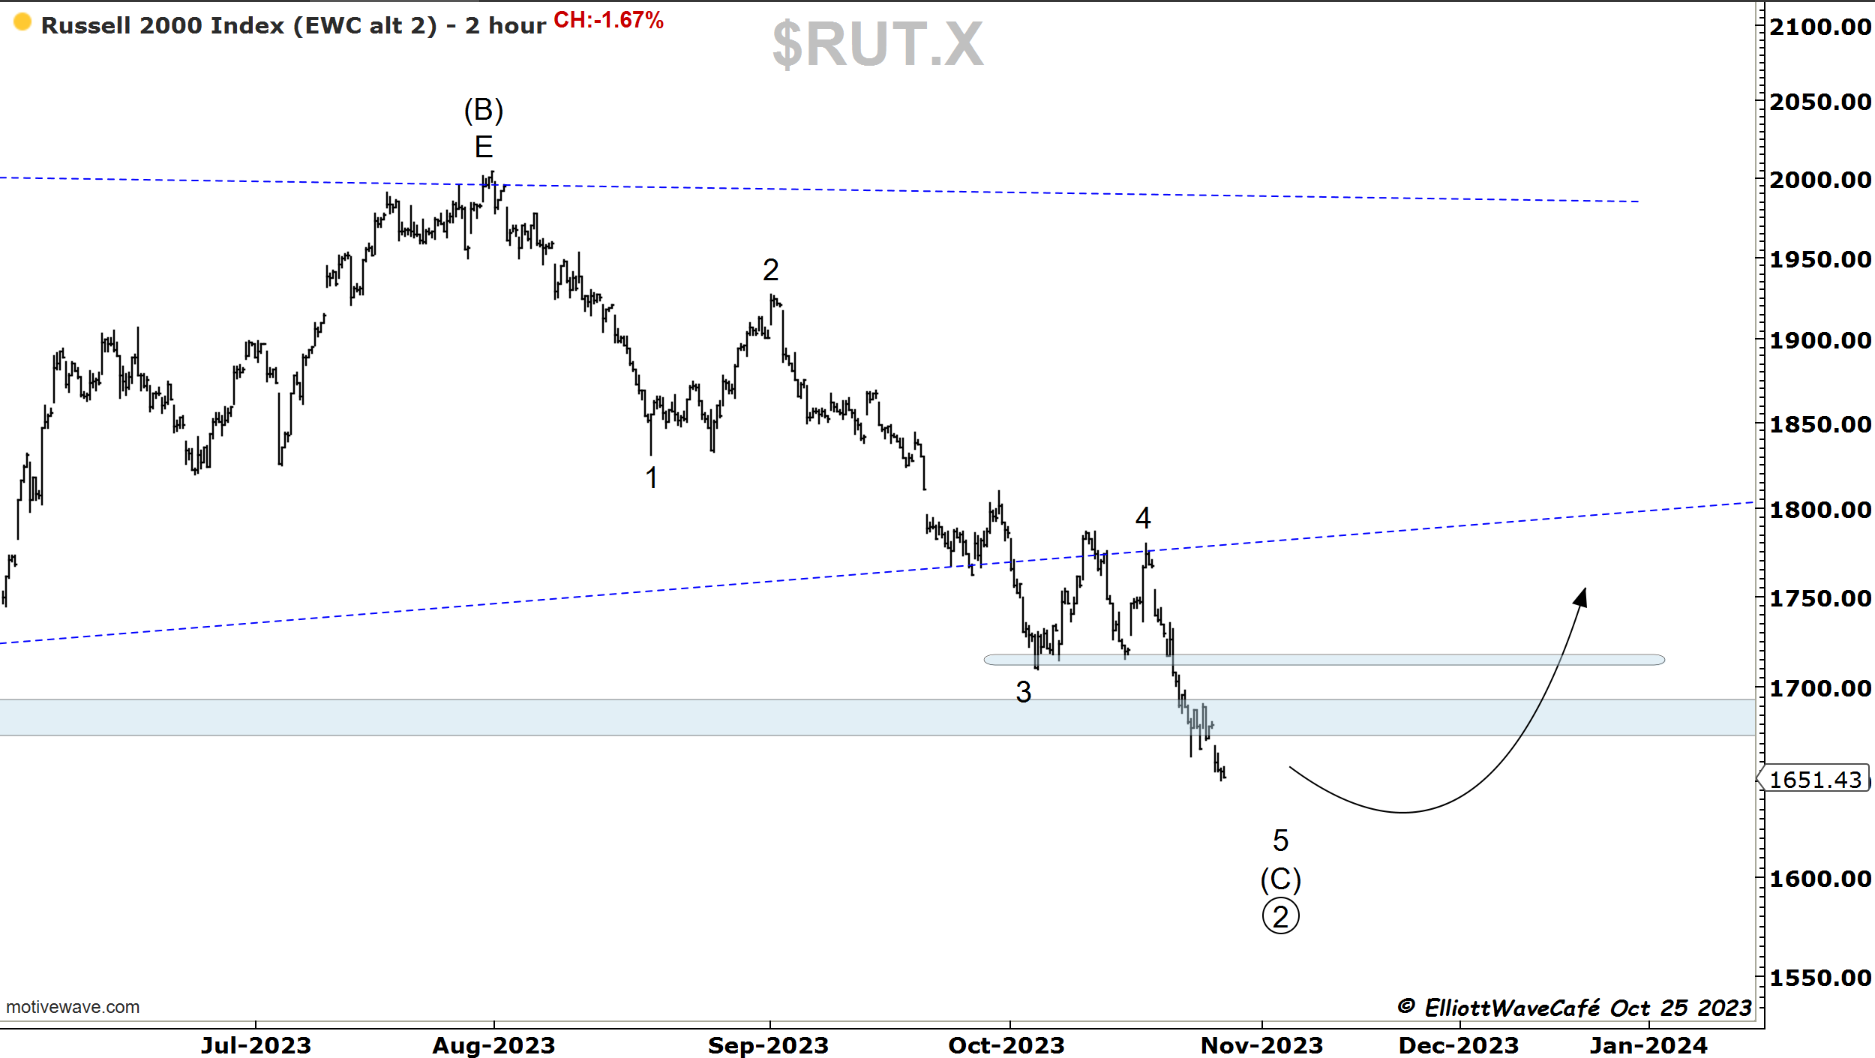
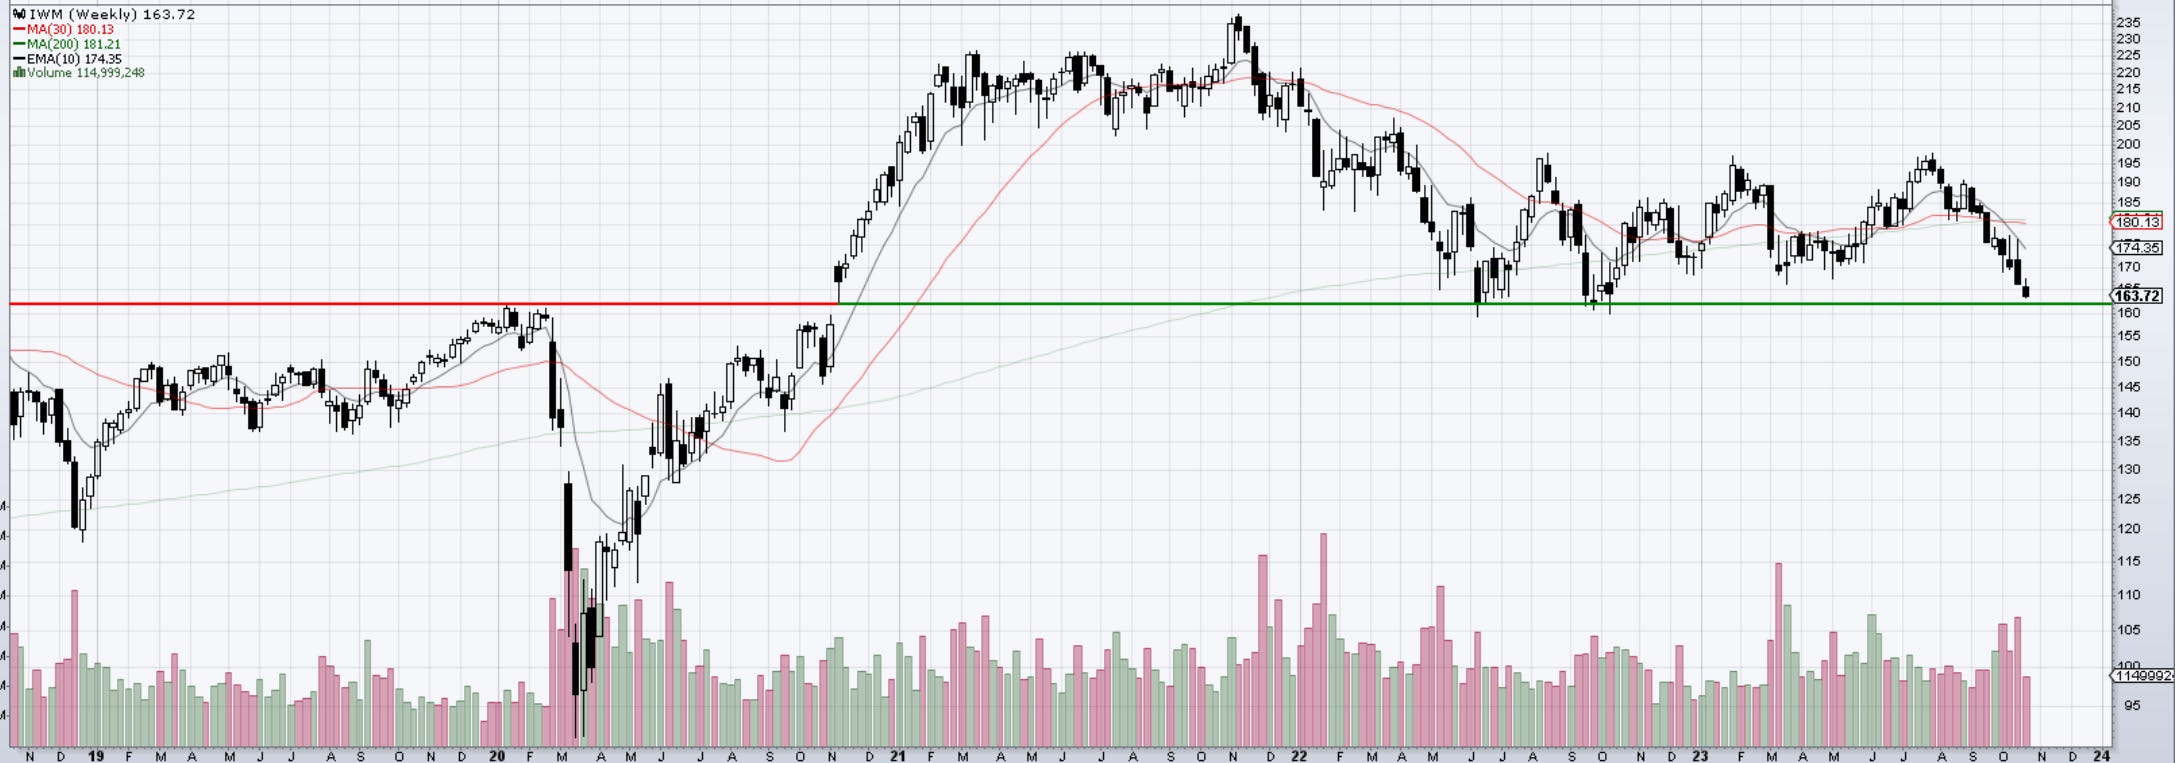
Russell gave up -1.67% working the final stages of this 5-wave decline. 1730 are the first upside targets, followed by 1800 zone. See the weekly chart below with S/R line on IWM.
Dow30
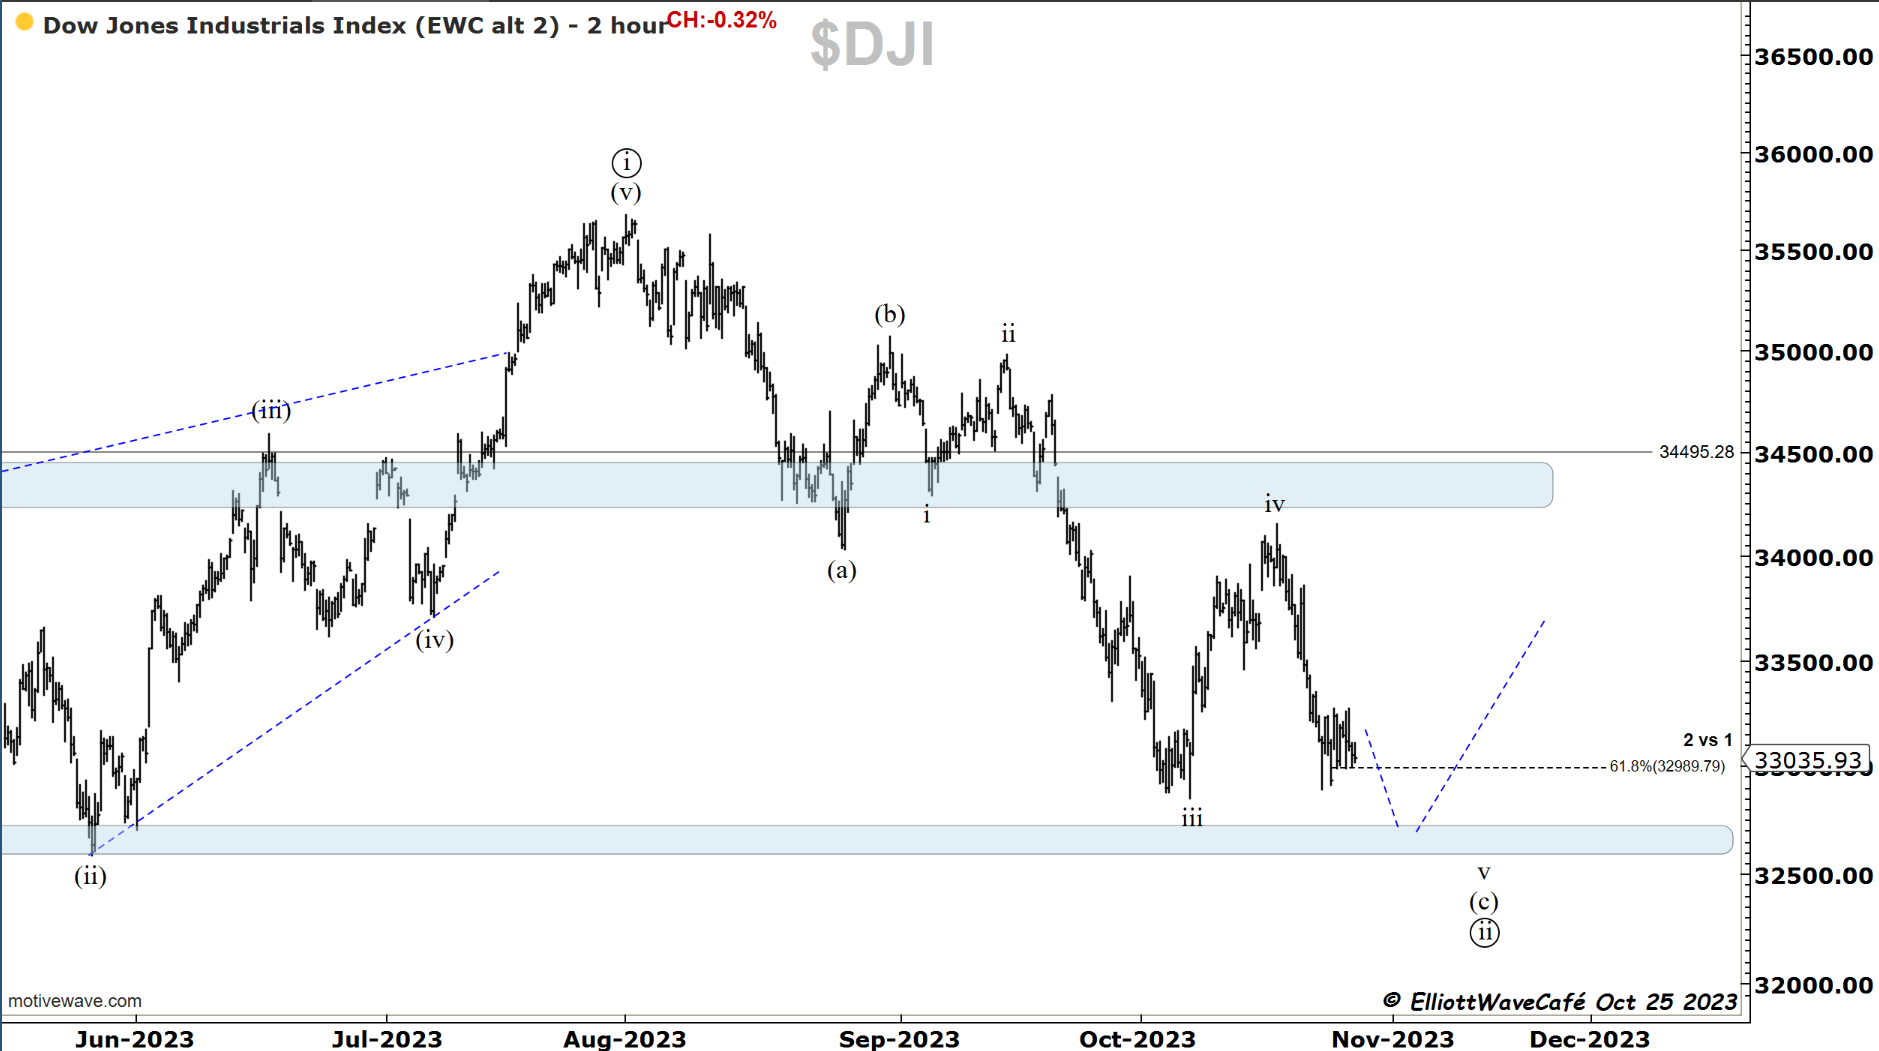
Dow industrials was the most behaved index today, only losing -0.32%. The chart pattern suggests however that there is another short drop in the cards before we can actually see a 5-wave move into wave (c) of ((ii)).
Here too the BPI is telling us to be careful on the short-side bets
US Dollar and Yields
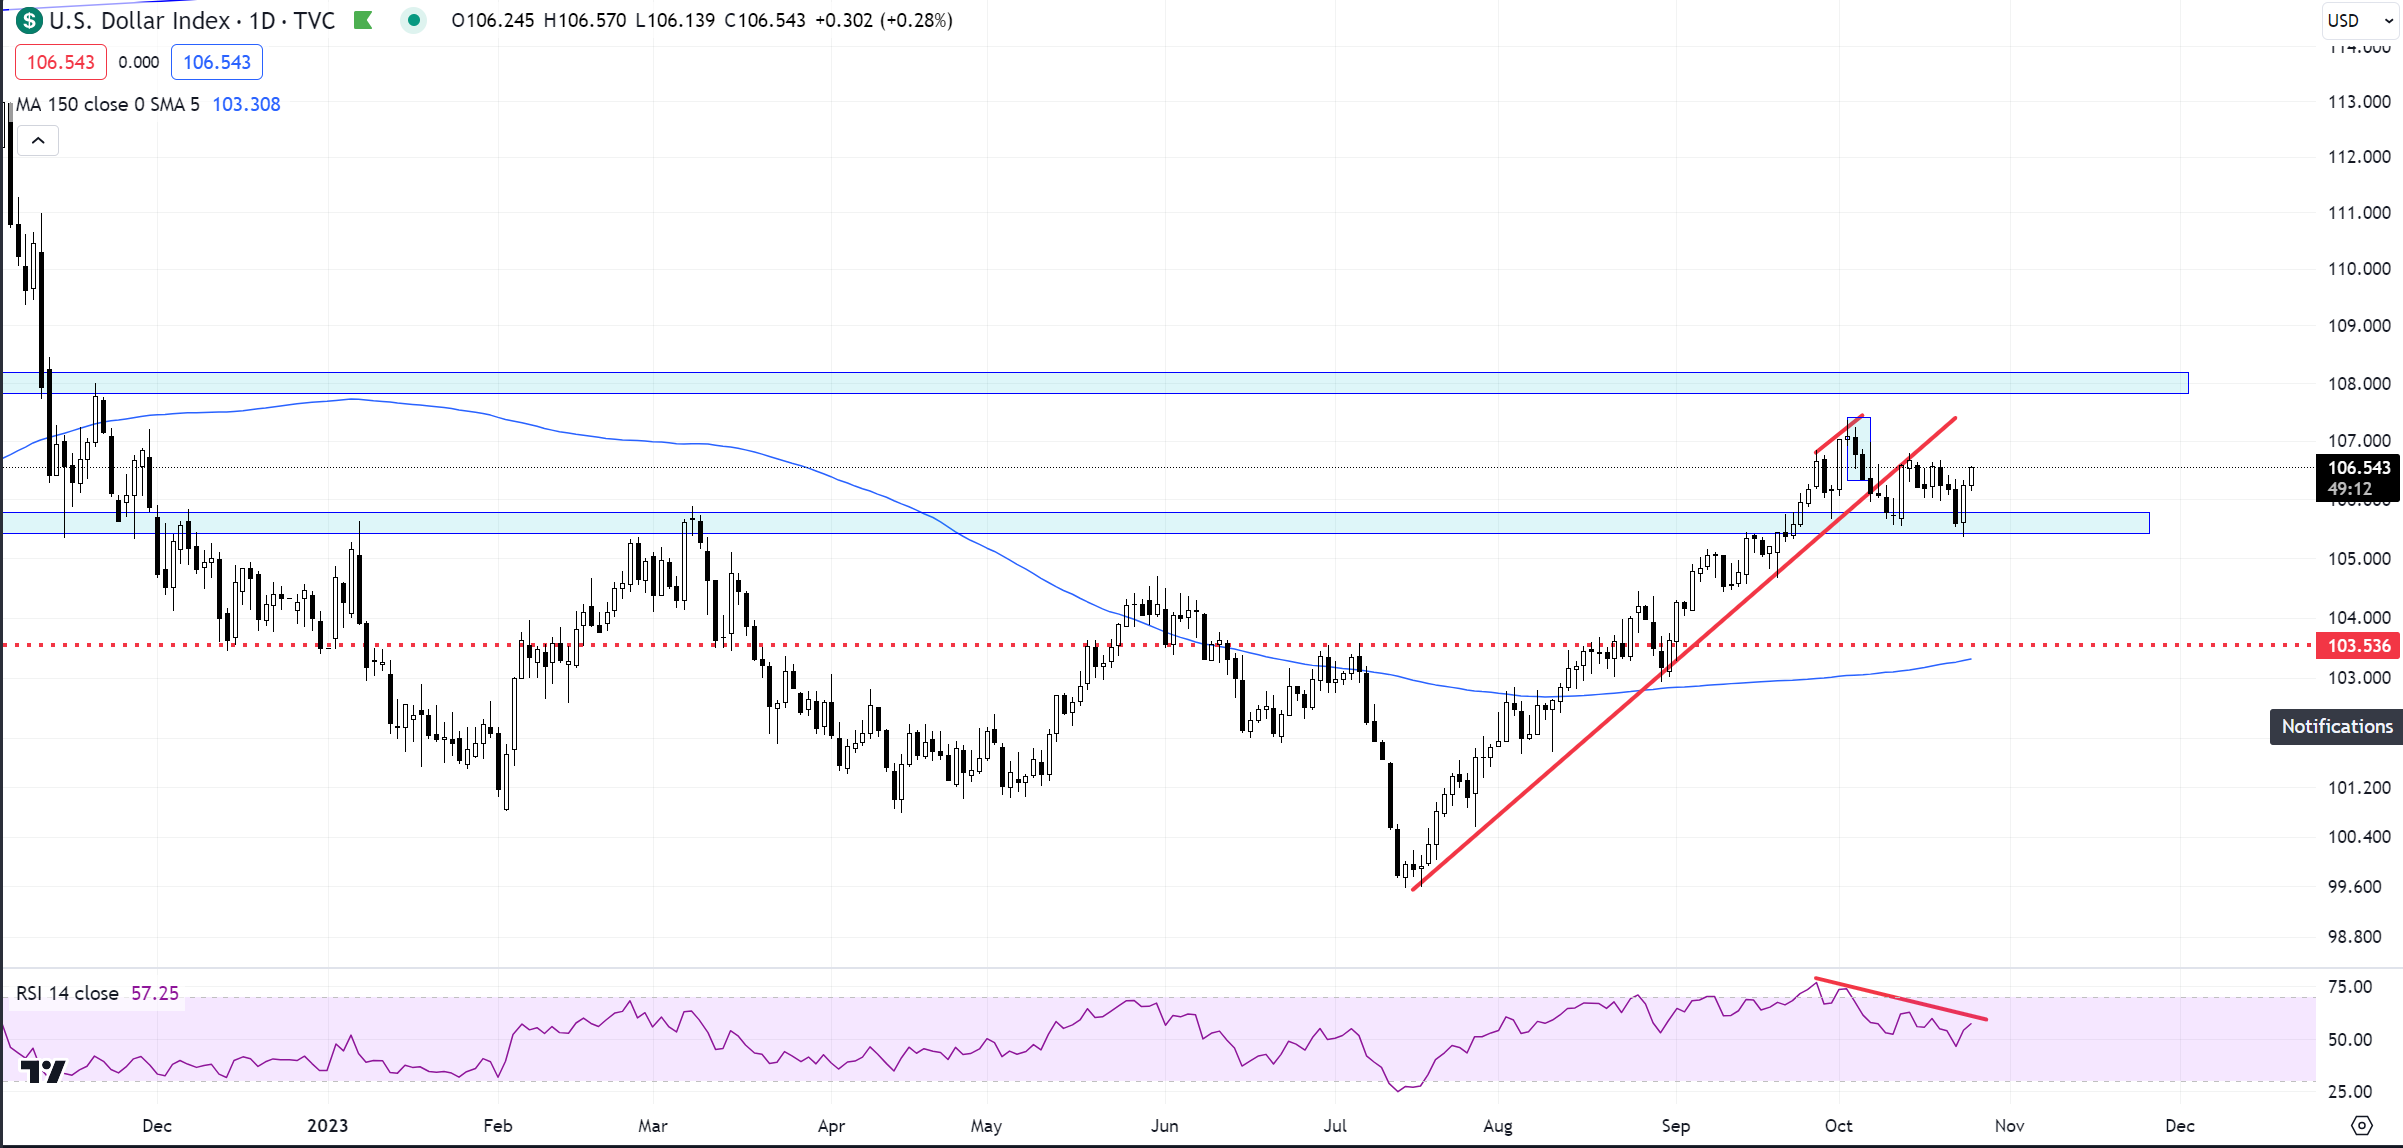
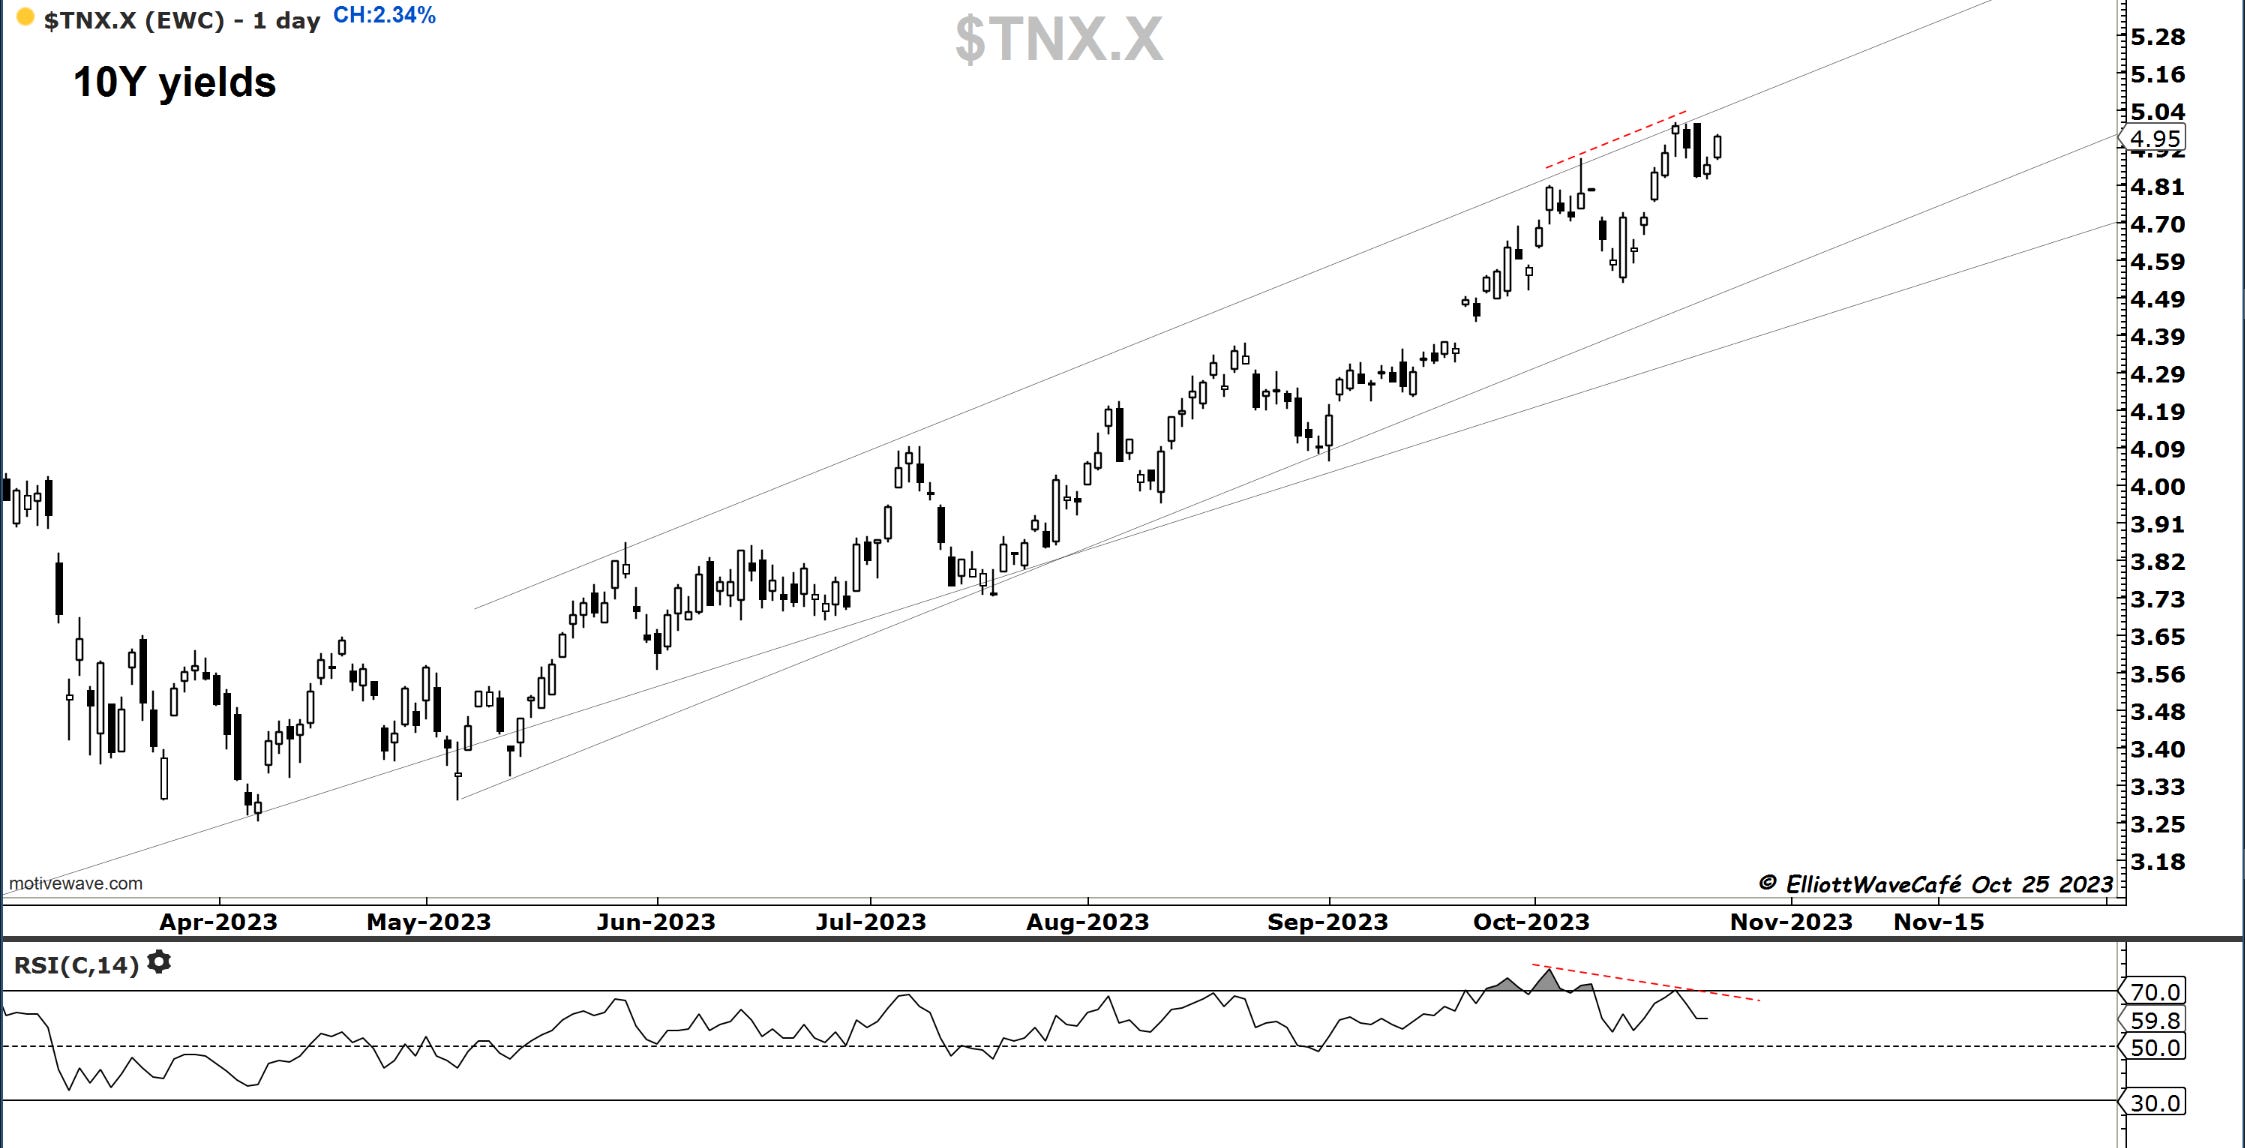
The dollar seems to regaining its strength but has yet to break 106.60. It continues to be an important gauge for risk, however surprising it has not yet broken much higher with the selloff in equities. Yields are trying the upside again but I think they’re running on borrowed time even if a marginal new high occurs. I would be on high alert for reversals here.
Gold
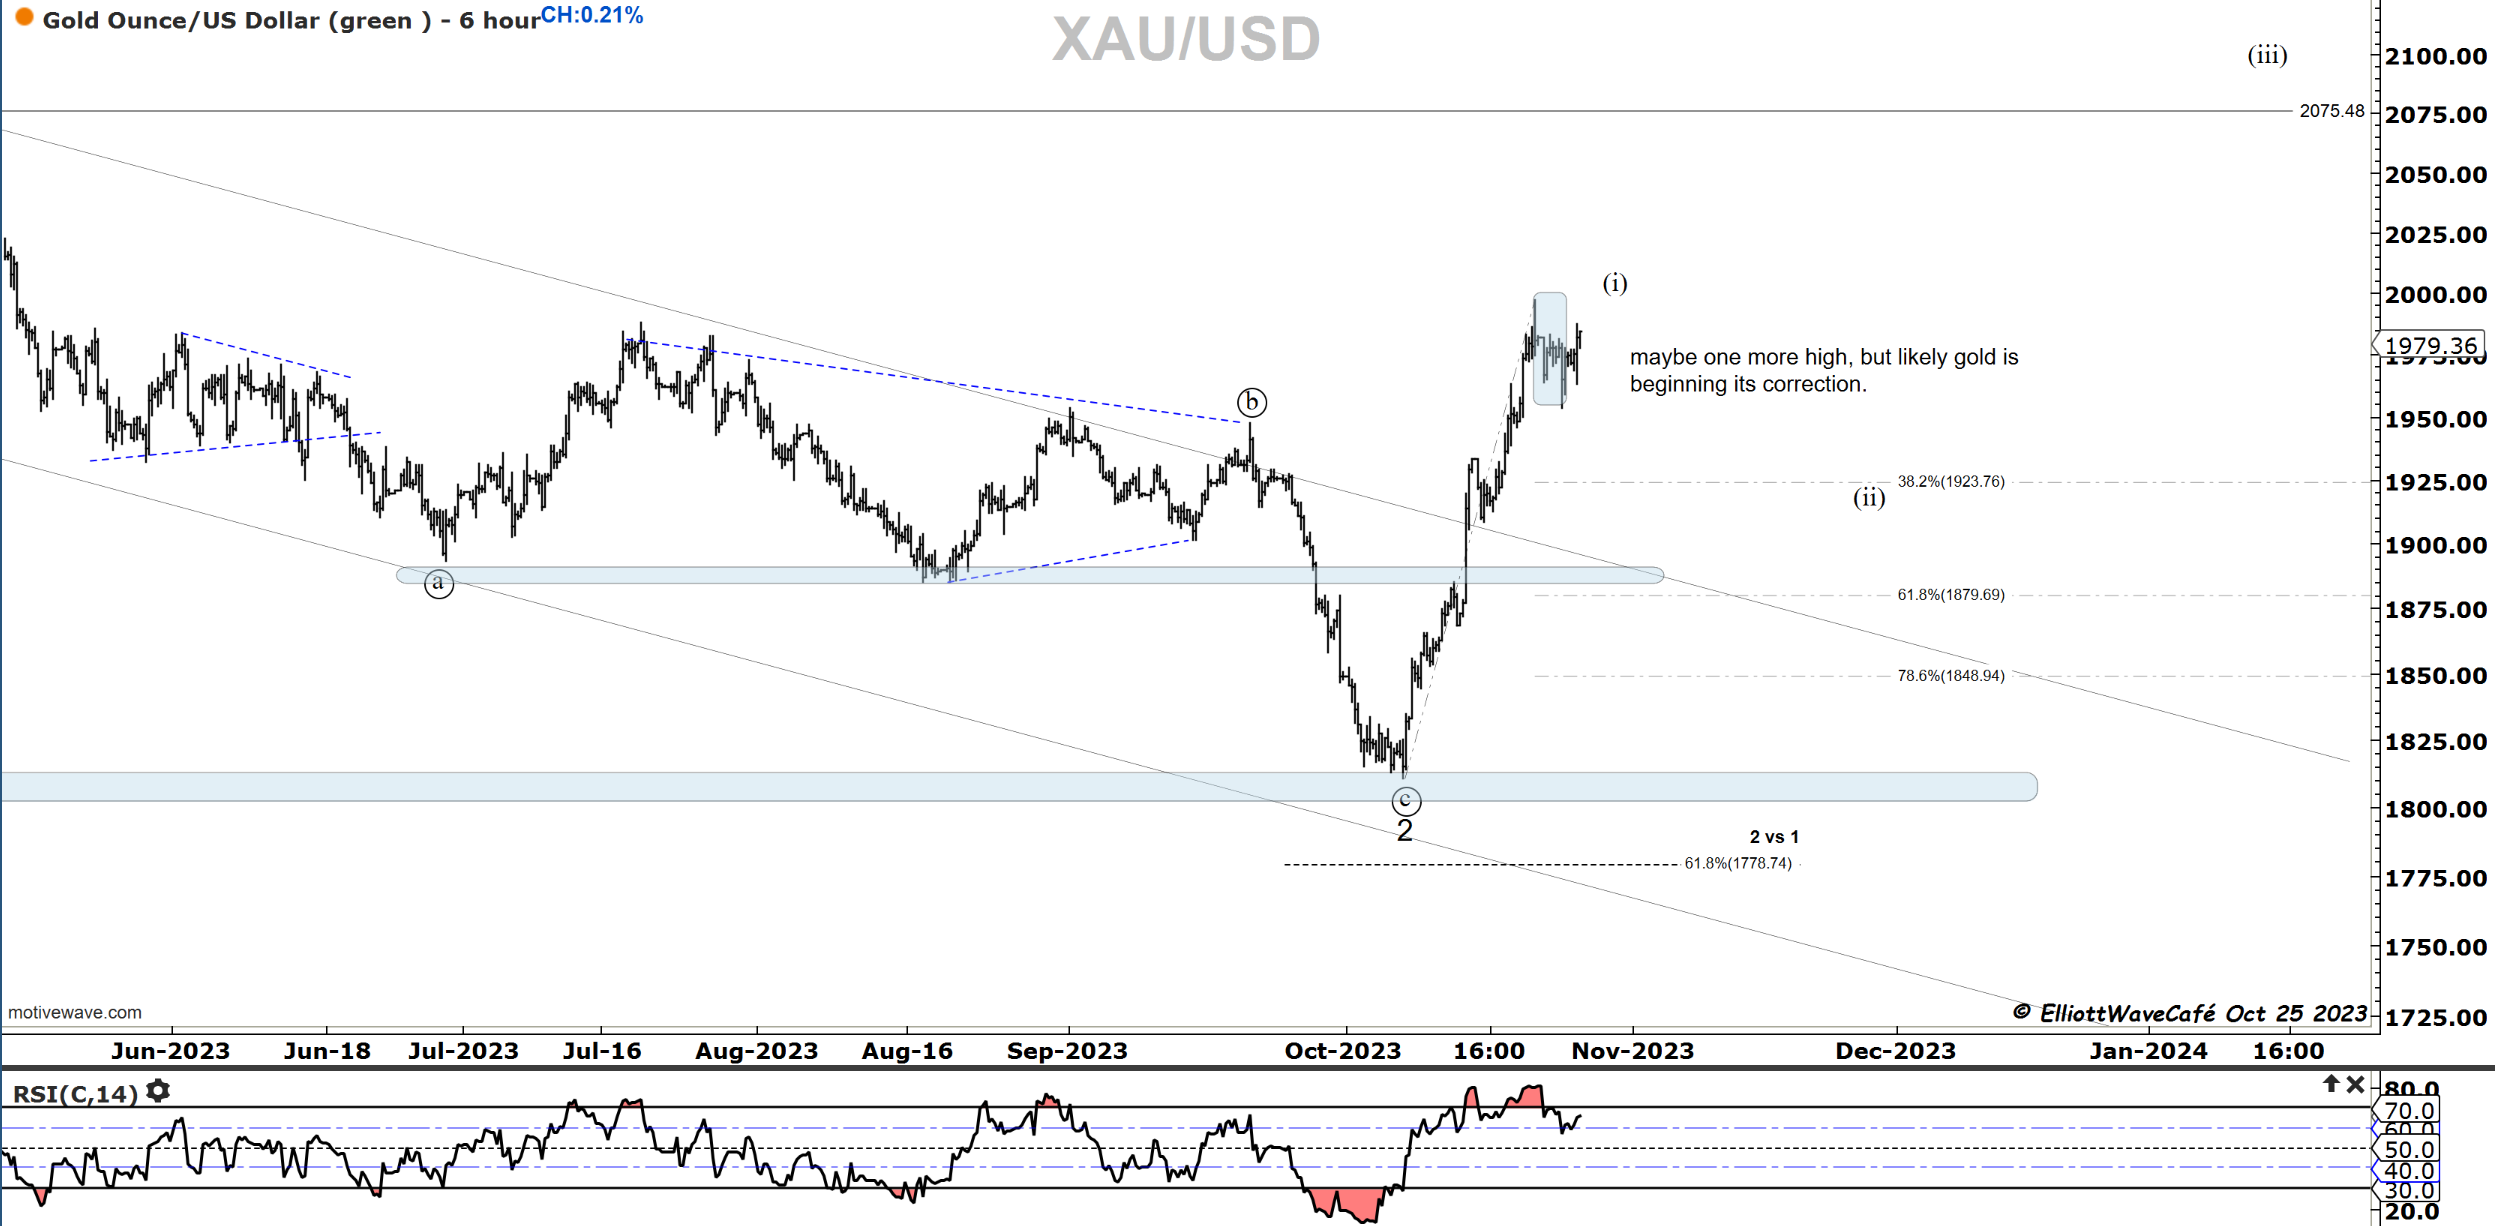
Gold continues to struggle here and it’s on alert for beginning the wave (ii) correction.
Bitcoin
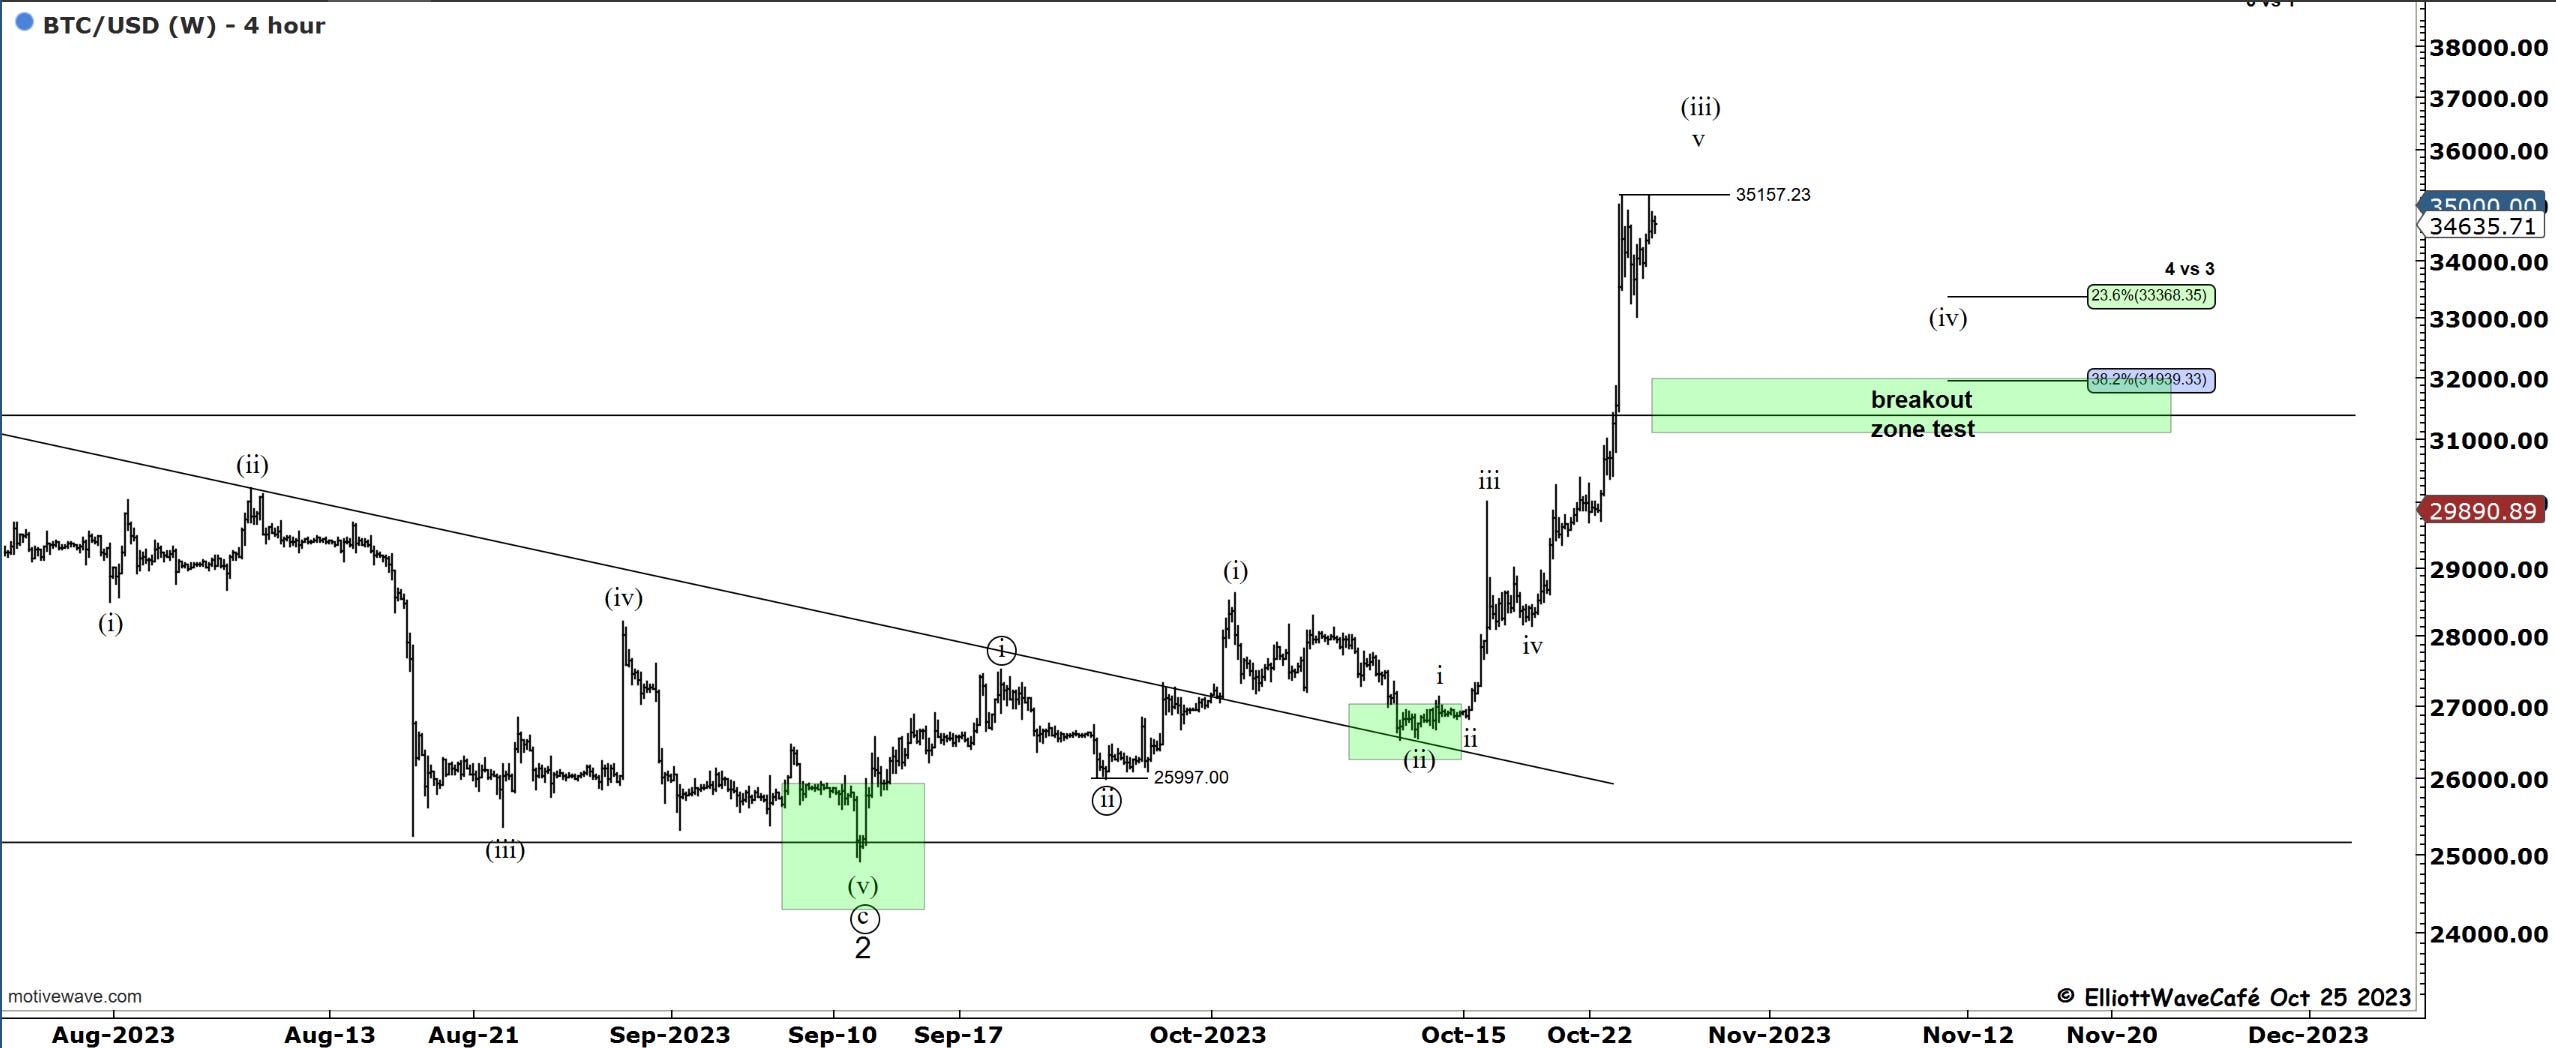
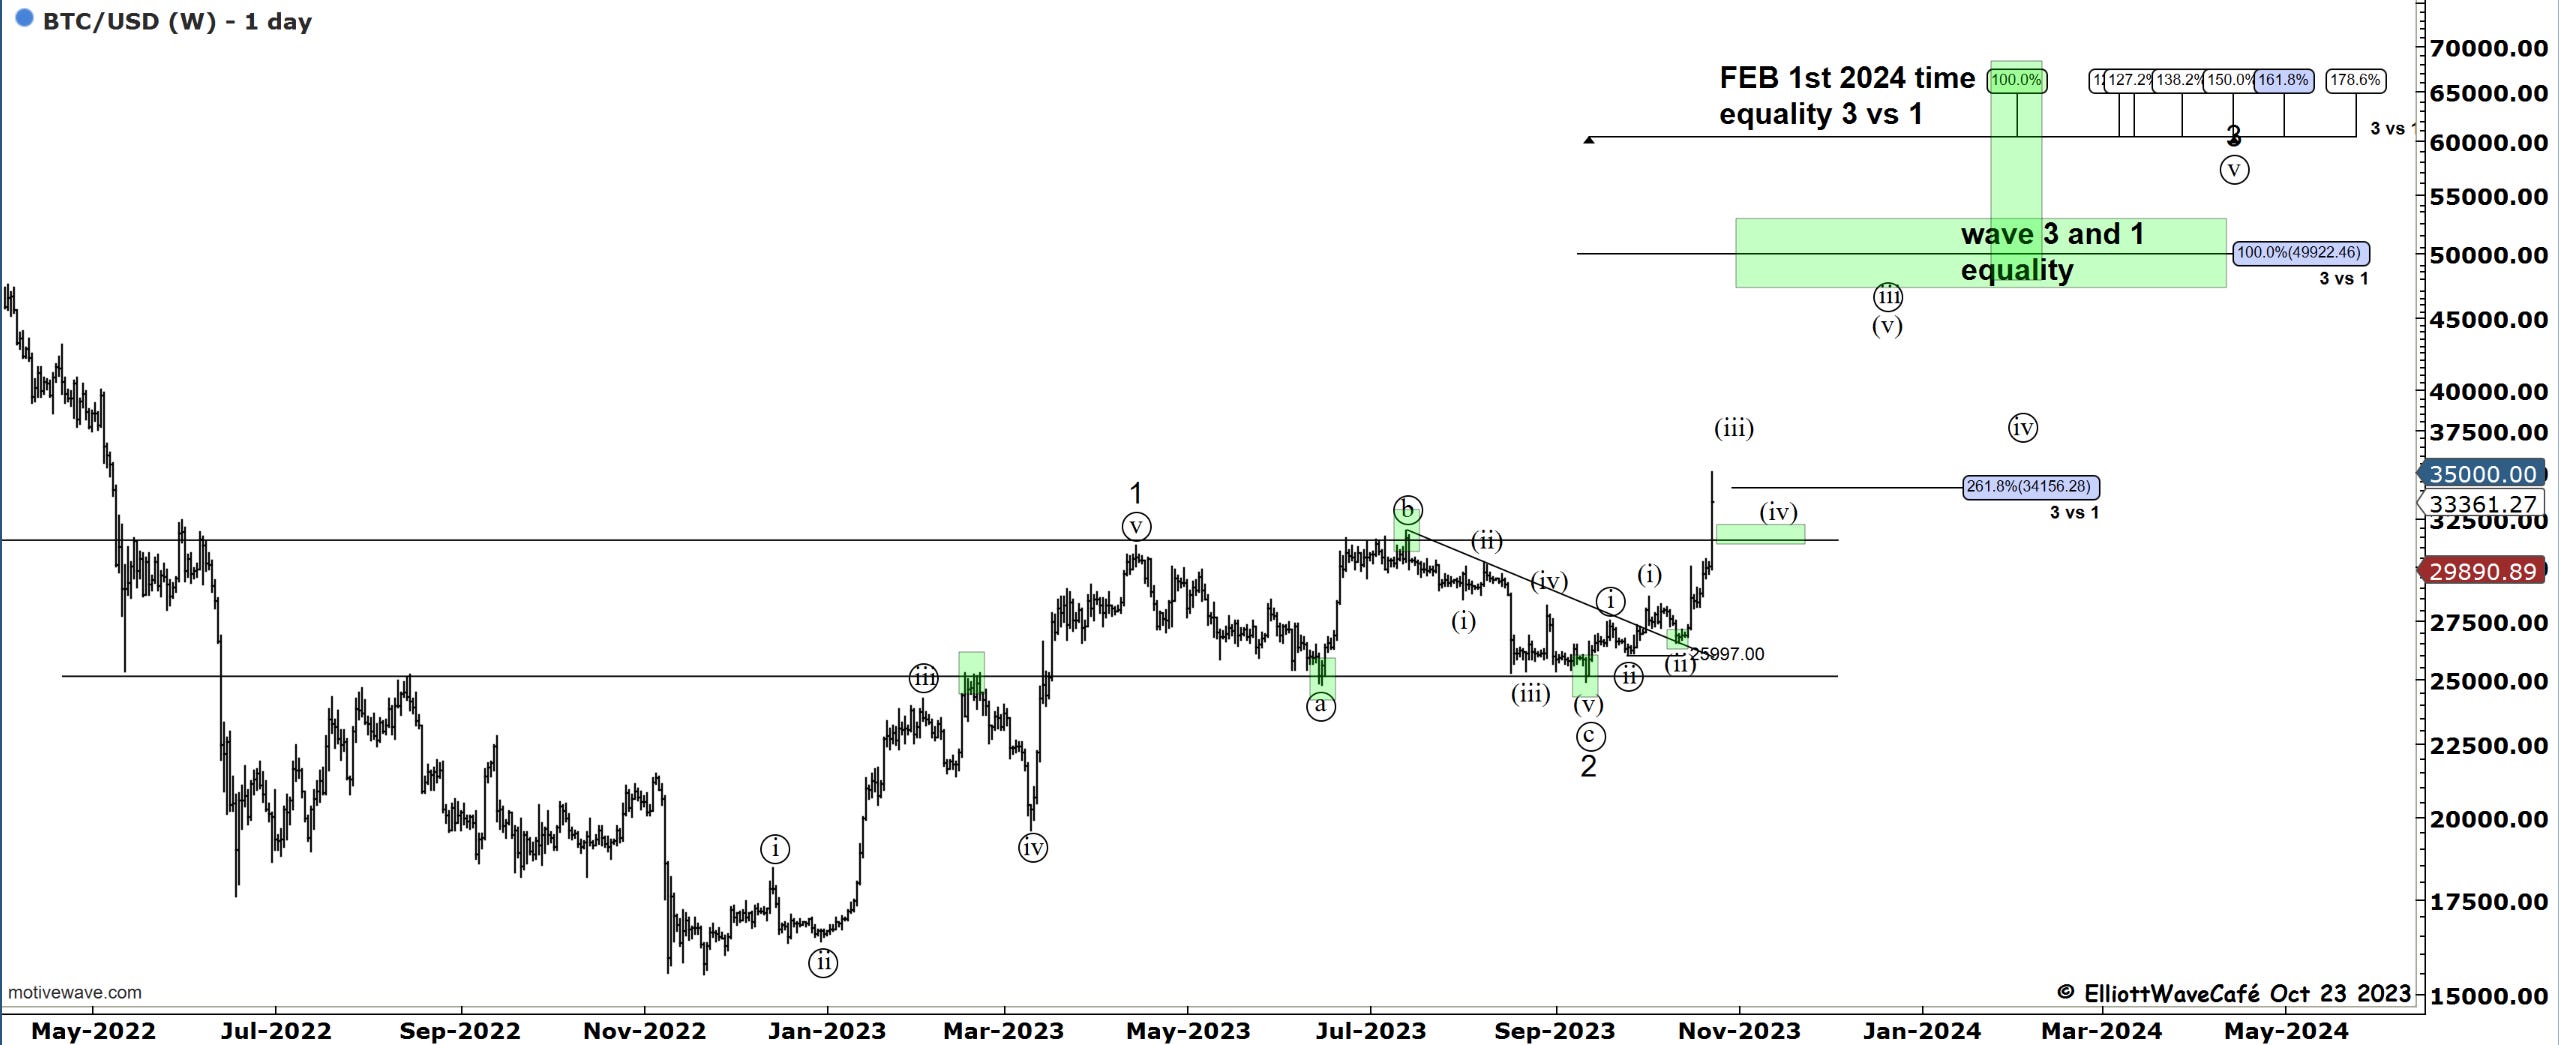
As expected BTC is trying to finish off a wave (iii) advance. It has tried once again to test 35,157. From here things might prove to be a bit more difficult and the momentum is expected to subside. It is not bearish in any way, but rather the anticipation of a wave (iv) correction is growing.
Depending on where wave (iii) actually terminates, we should have a 23 to 38.2% pullback. That puts us at the 32-33k zone initially. It should give way to the next opportunity for trading a wave (v) advance.
Daily video coming up next,
See you next tomorrow - trade well,
Cris
email: ewcafe@pm.me