
The Daily Drip
Core markets charts updates and commentary
Note: The counts on the right edge are real-time, and they are prone to adjustments as price action develops. Elliott Wave has a fluid approach, is evidence-based, and requires constant monitoring of certain thresholds.
In the counts below, this (( )) = circle on chart
This is the last report of the week. I wish everyone a great weekend!
SP500
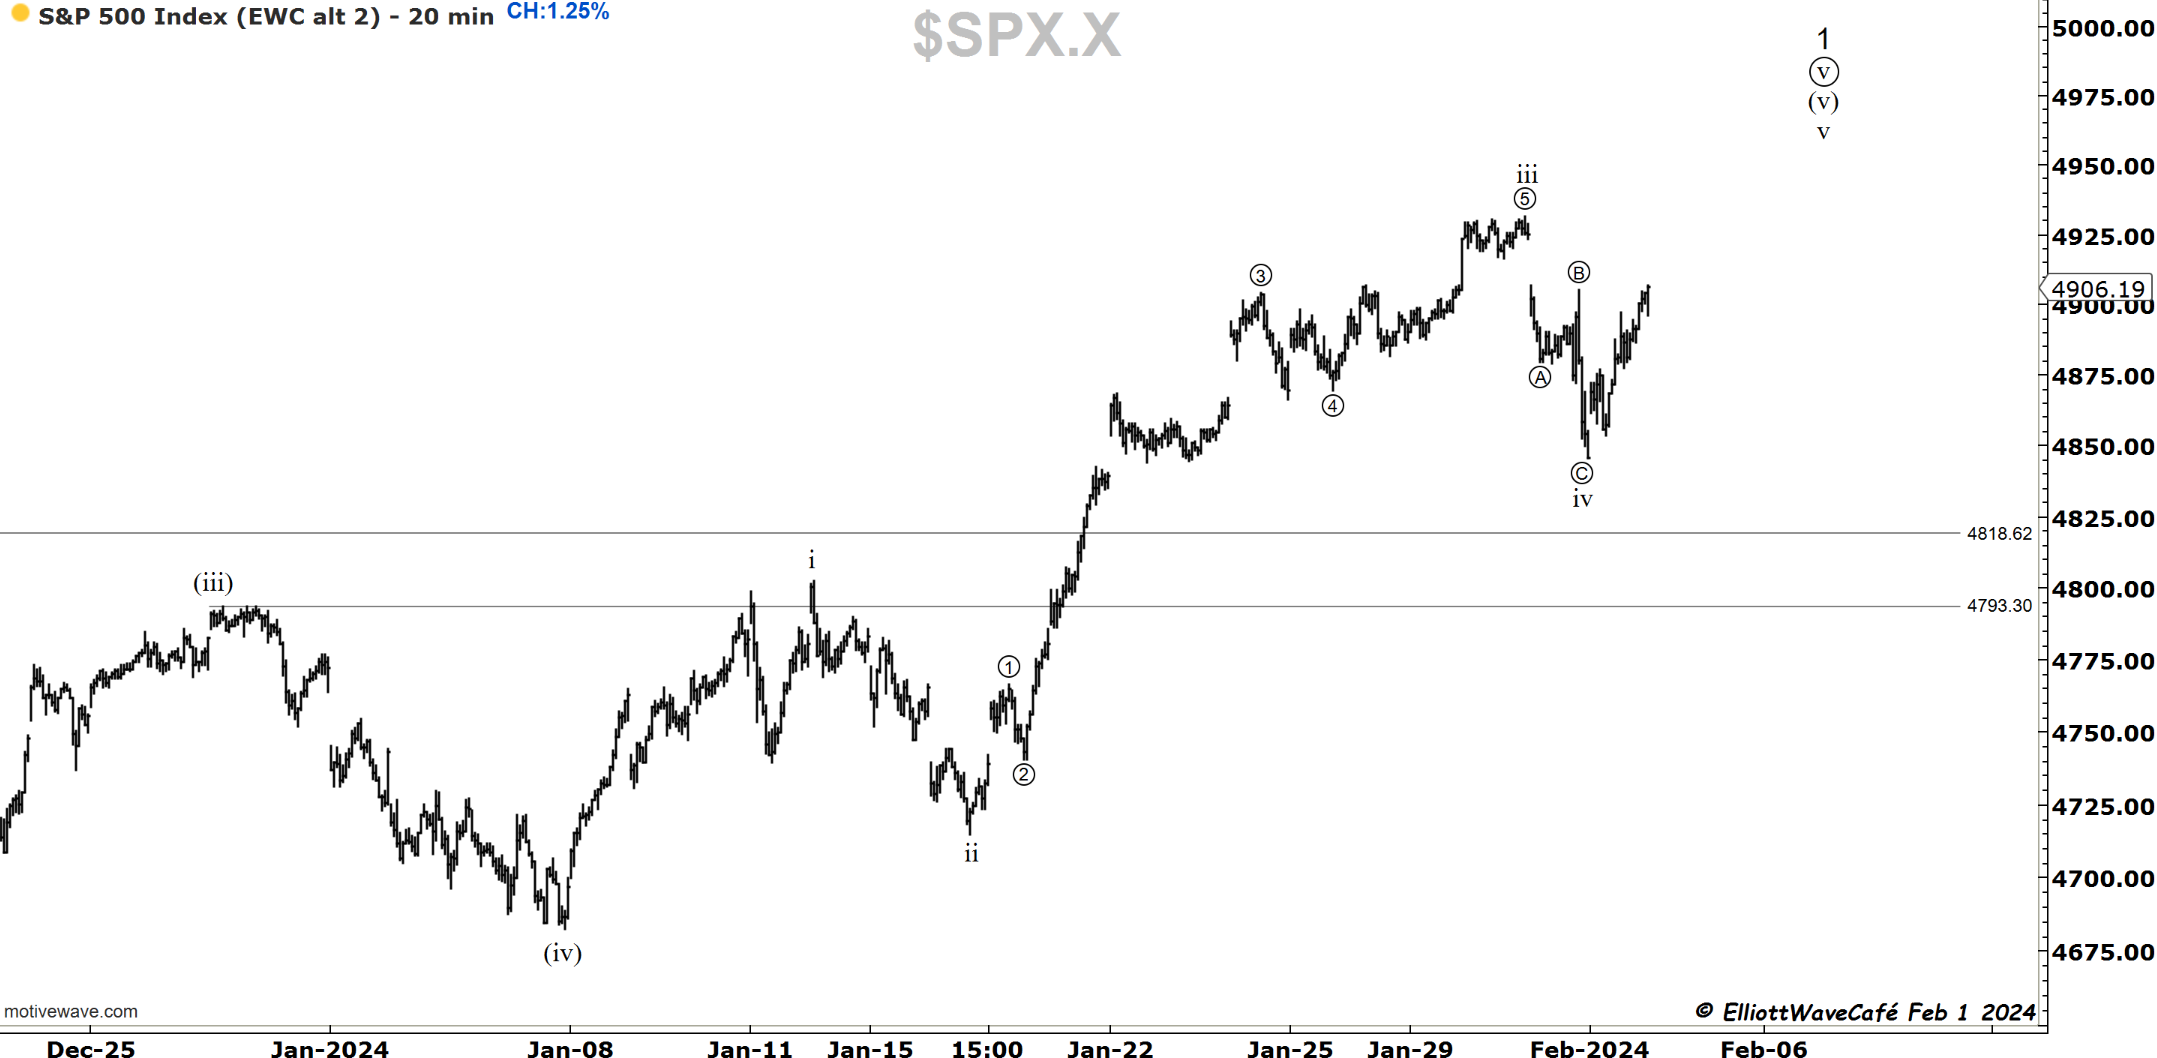
The market recovered a bit more than 62% of the last two declining days. Today’s late earnings on META and AMZN have helped propel the futures higher, but overall, the market was bid the whole day. AAPL, on the other hand, broke 180 in the after-hours after that large 3-wave rally from Jan 5th. It’s creating a bit of a mixed picture with an important jobs report due tomorrow morning. I have adjusted the count slightly to allow for one more push for wave v. This displaces wave (iv) location. If we end up selling tomorrow below yesterday’s low, instead of making a new high, I will revert back to the original idea. It’s important to stay flexible when counting waves in real time. It does not change the larger picture; maybe it only delays it slightly. The 20-minute chart below shows only a 3-wave decline from the highs, which helps place a wave iv there.
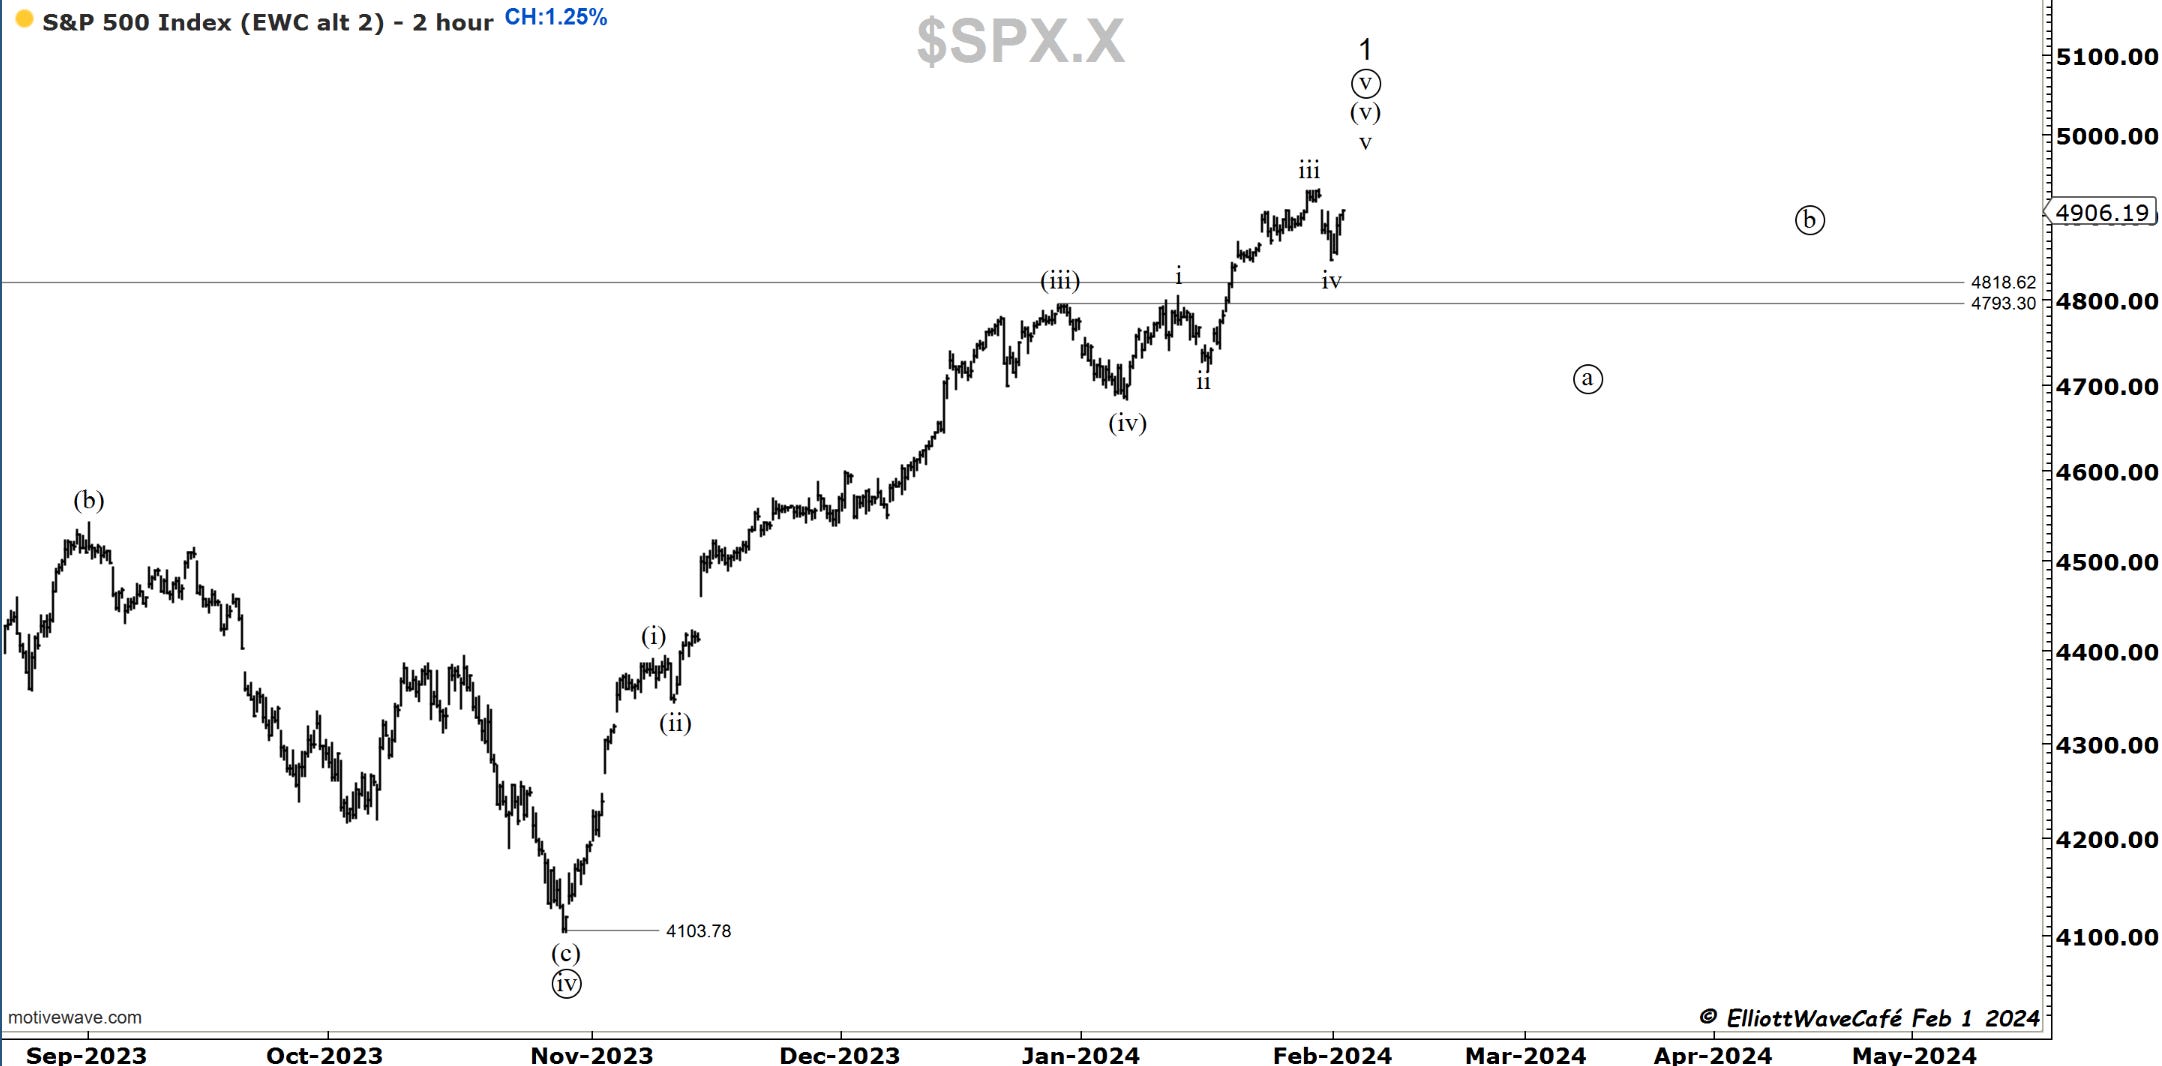
Like clockwork, she won't give up the 20-day that easily. I have identified support slightly lower at 4800, but I guess bids were placed just ahead of that level. Let’s see if they can take this up tomorrow.
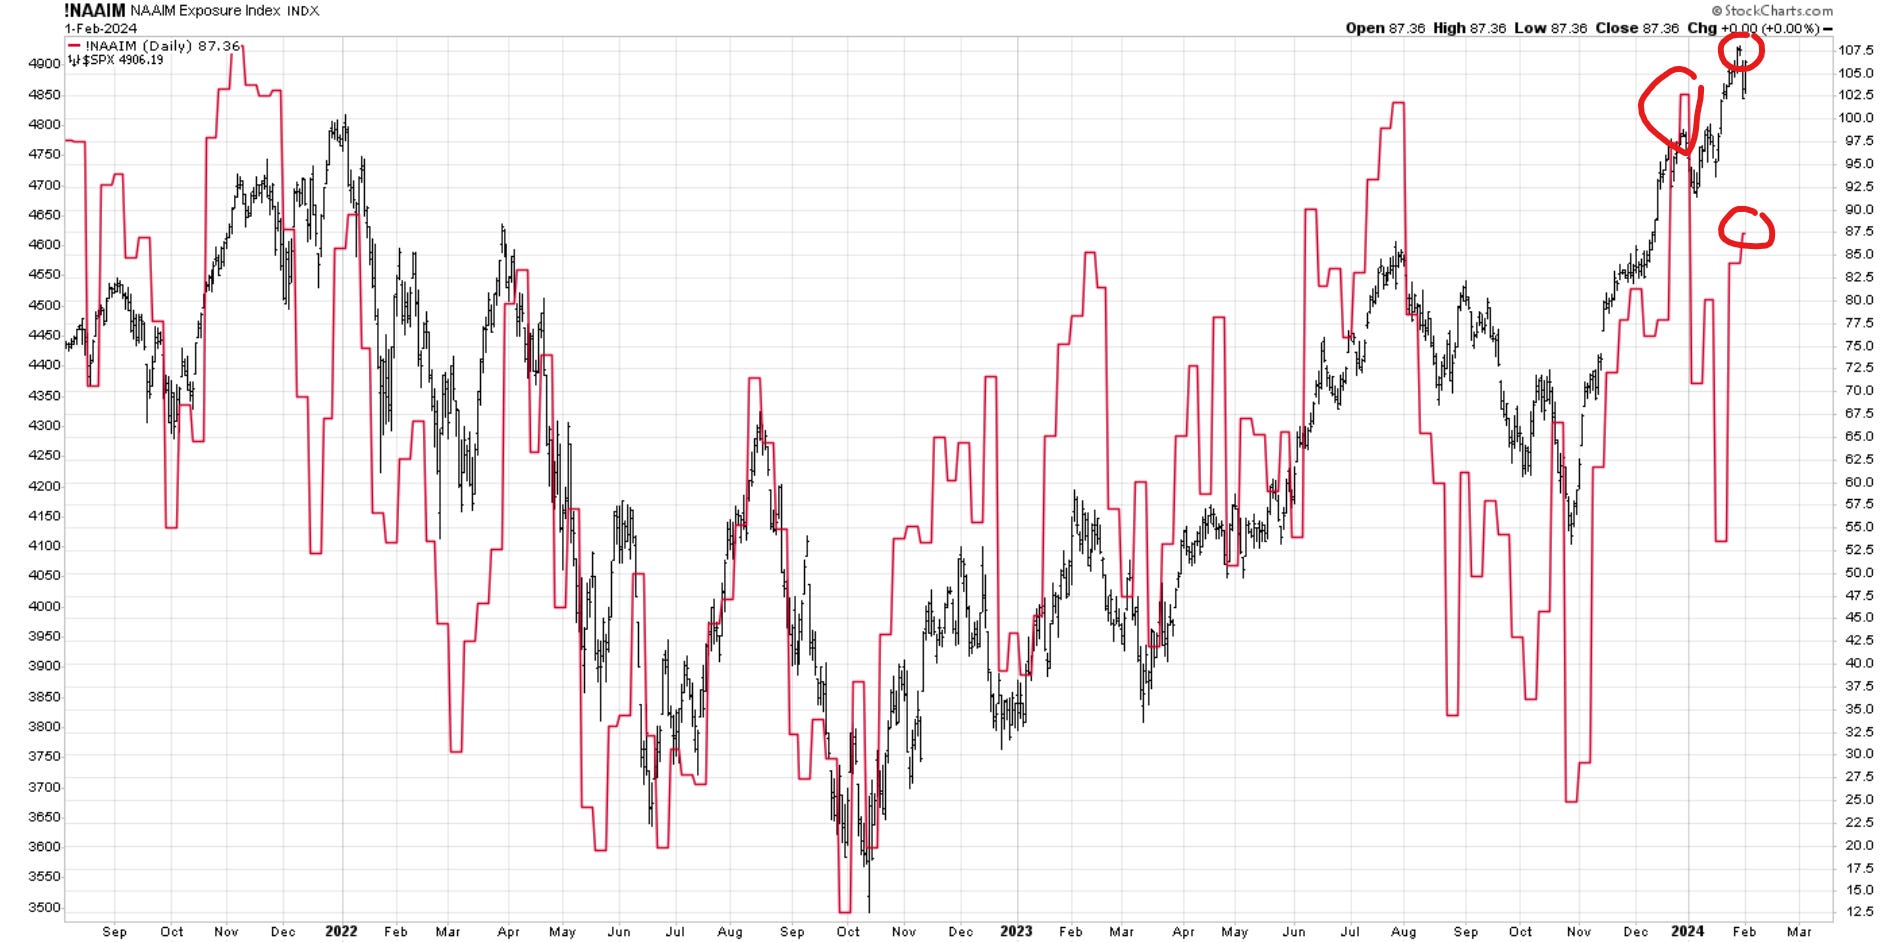
Intersting how asset managers are afraid to chase up here. They had max exposure at the end of last year, but now, at all-time highs, they dropped to 87.5%. What would it take for them to get back in the saddle, or do they sniff something fishy up here and want to be less involved? We will find out as February drags along.
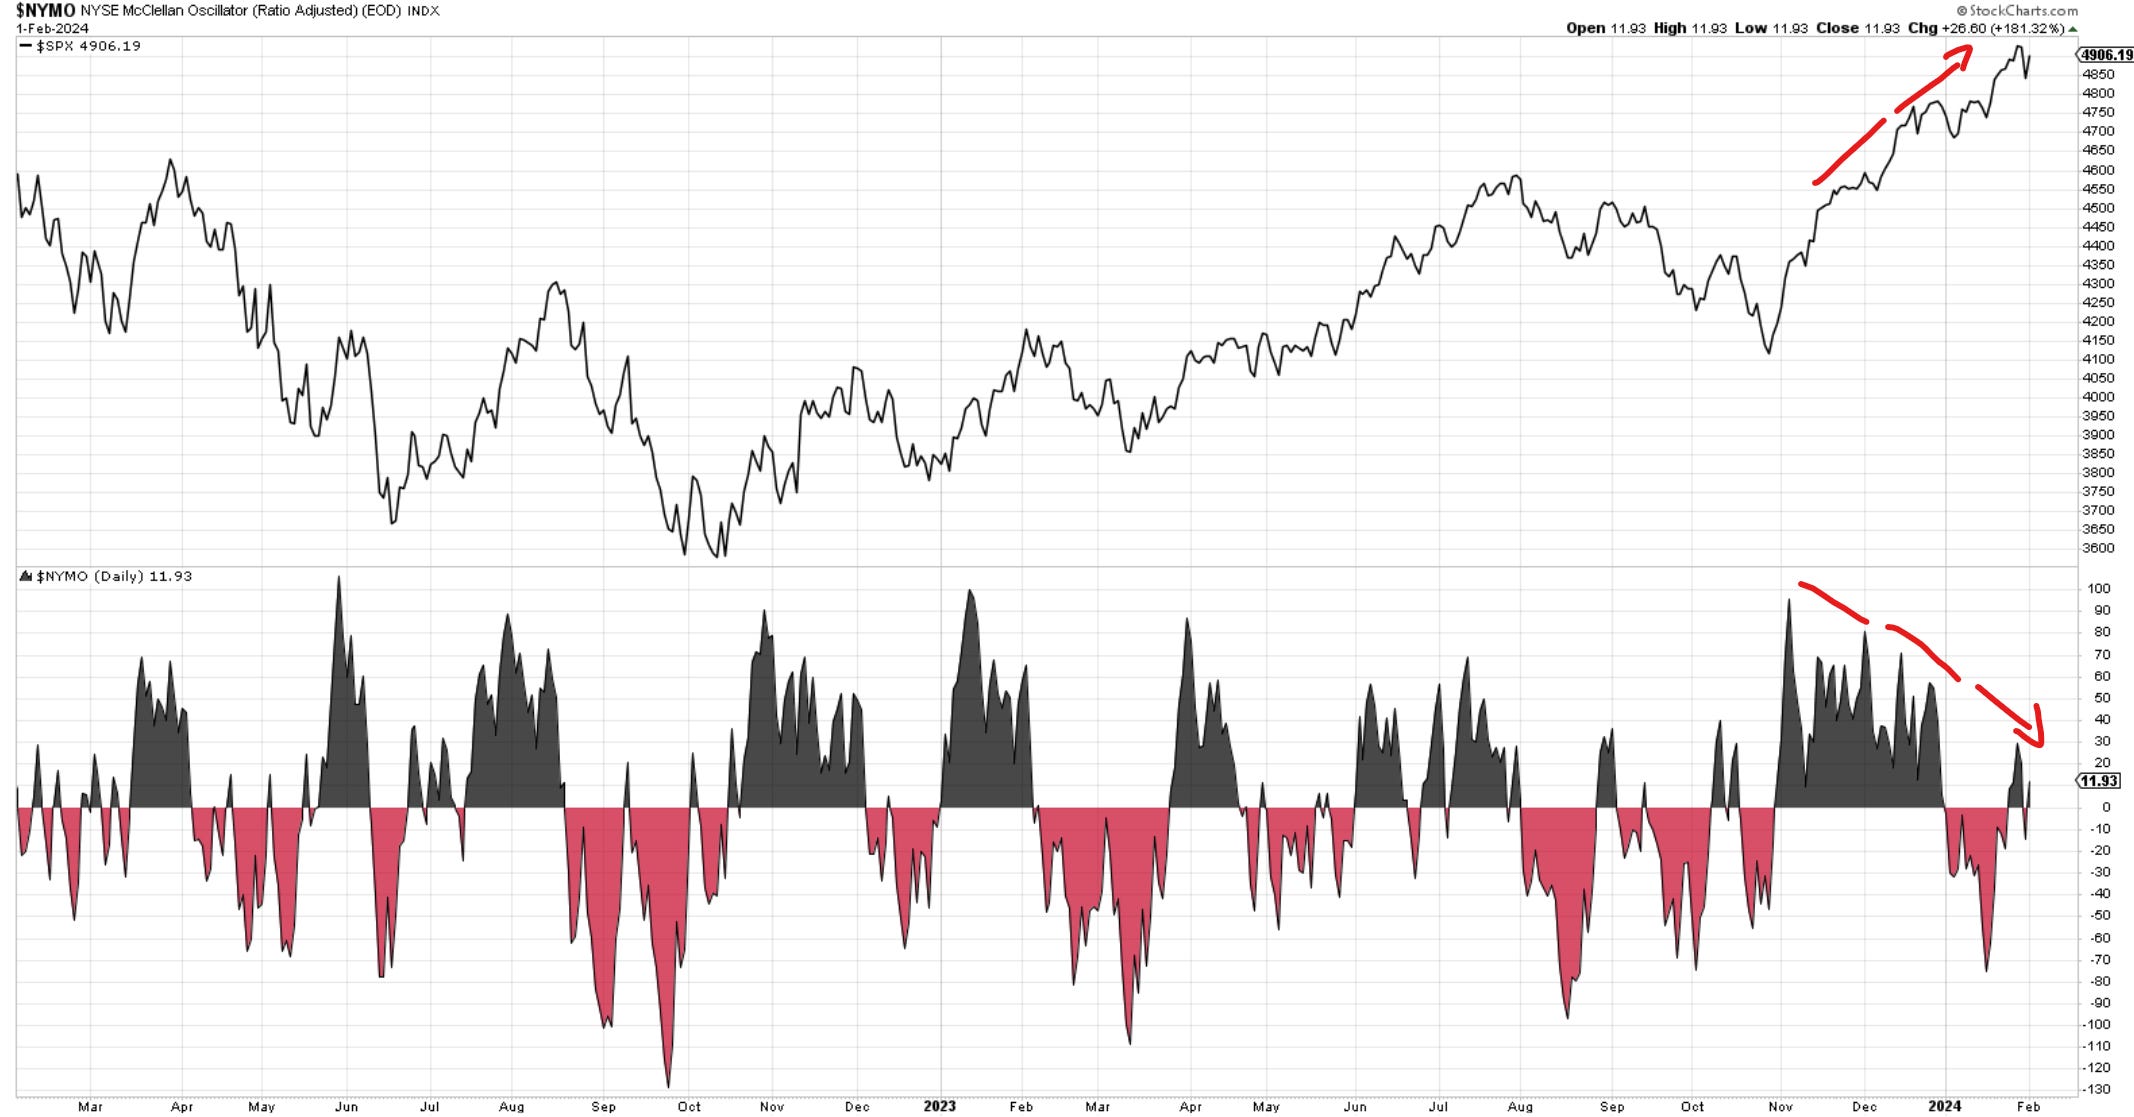
I can’t help but notice the deteriorating breadth ( advances vs declines) as depicted here through the McClellan oscillator.
01/30 - Channels are sometimes imperfect, but just a quick glance below suggests that the odds of a pullback would be higher than the odds of a continuous breakout. At this juncture, I would continue to be a trimmer, call seller, put buyer, and straight seller.
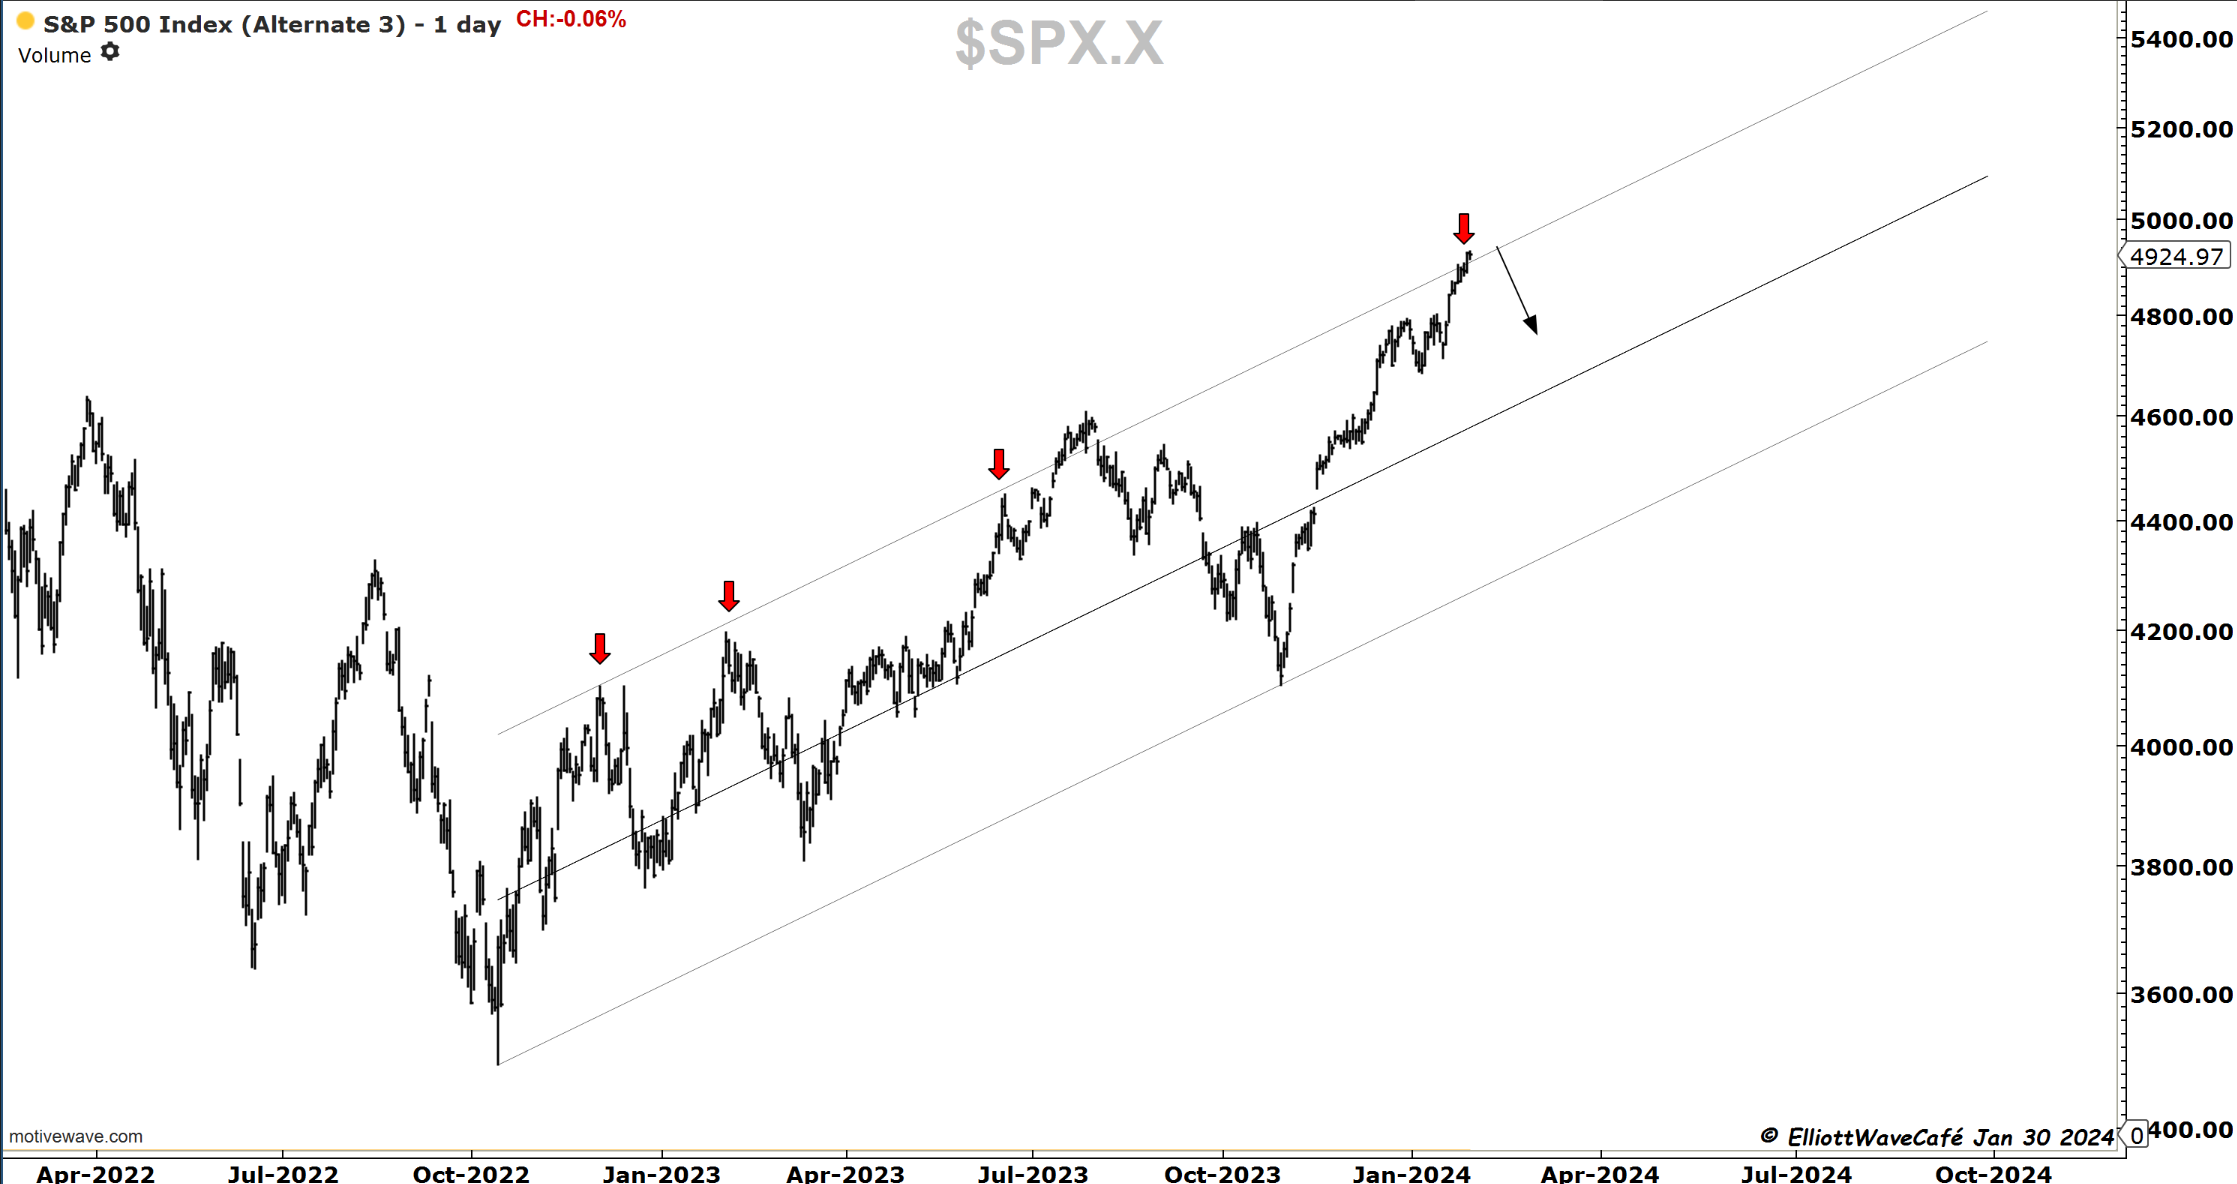
The bottom line is that I am wary of this market and its behavior at these highs. My bet is that we will see a corrective move unfold over the next couple of months. The pure price evidence still remains inconclusive and will remain so until we break some of the key levels mentioned.
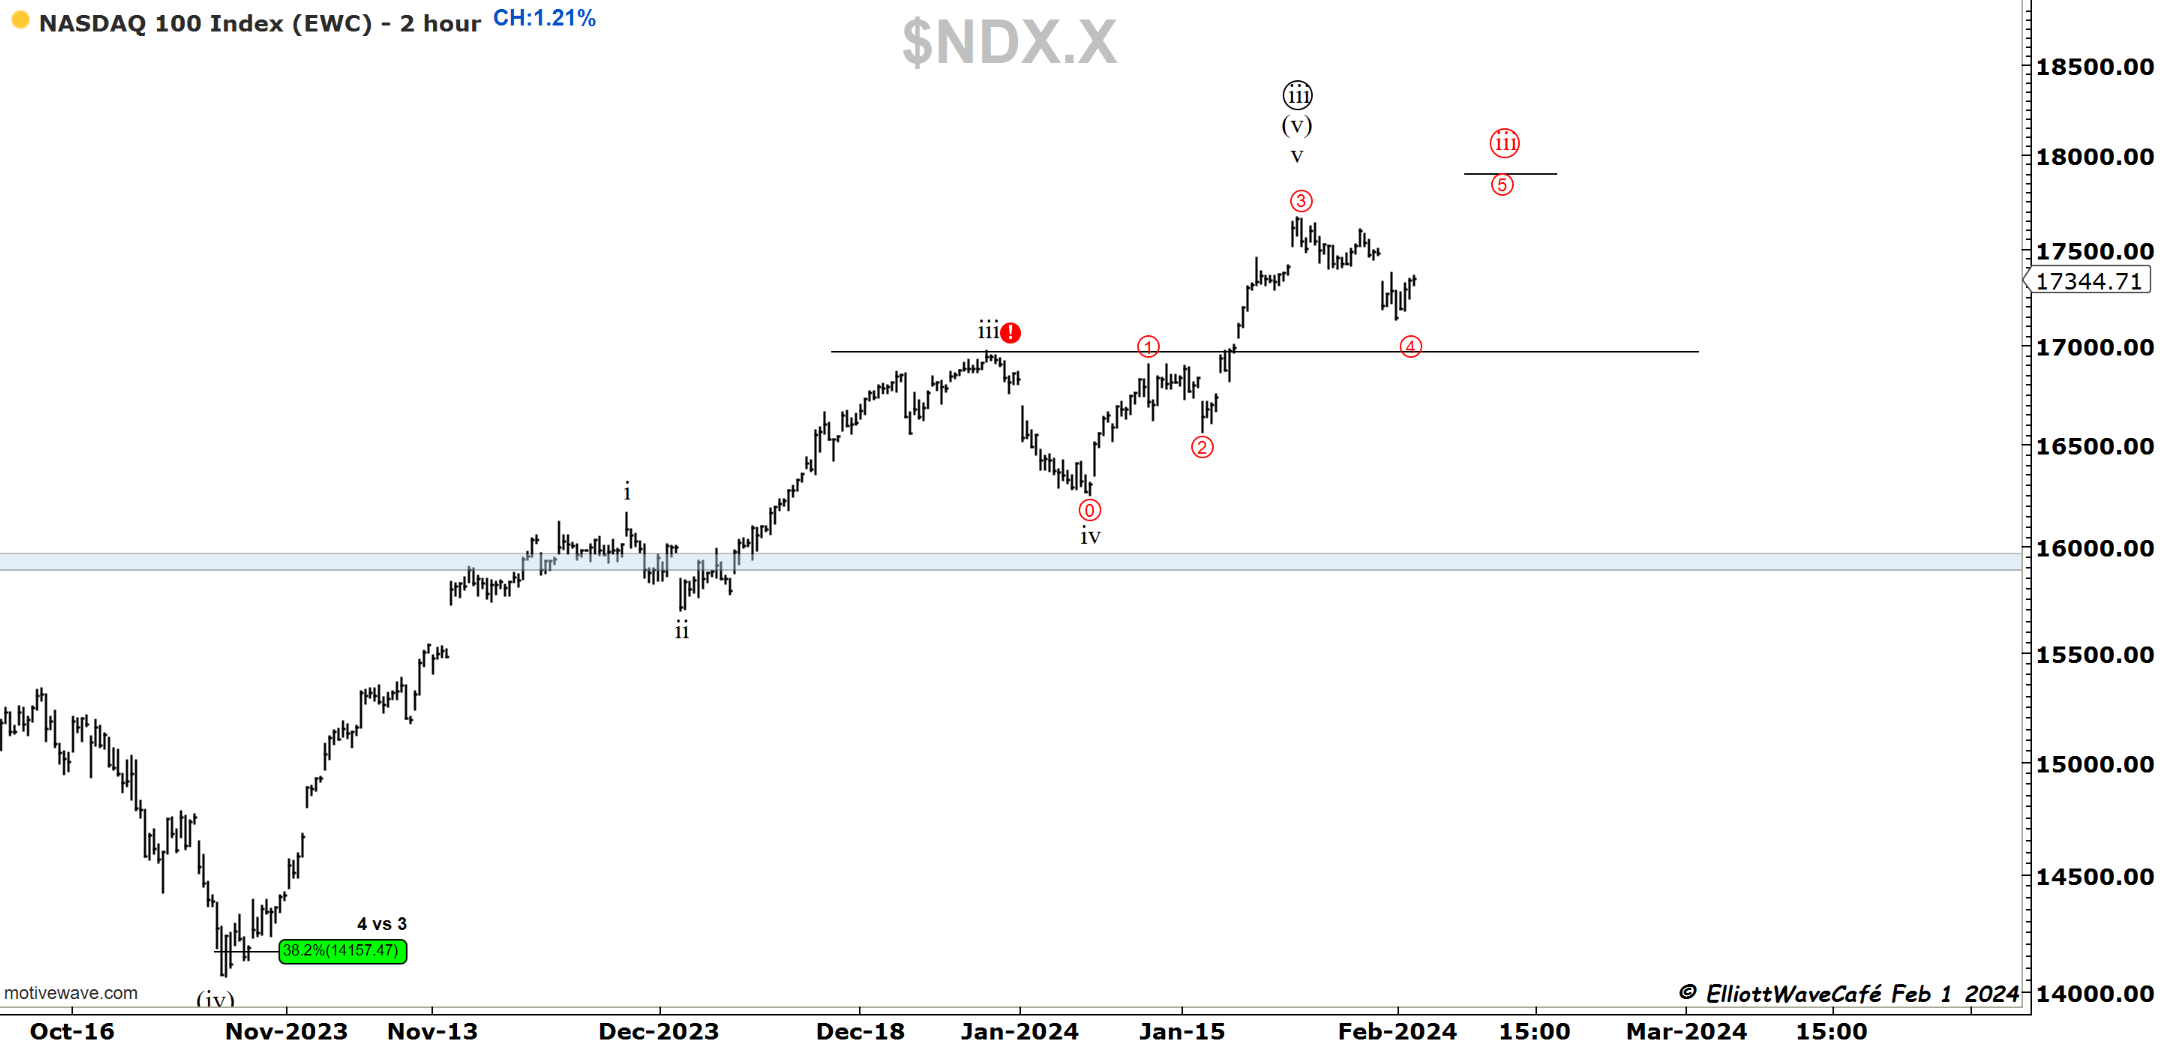
Nasdaq100
Nasdaq rallied +1.21% but really wasn’t able to threaten the prior highs until in the after-hours with the strong reactions from the stocks mentioned above. If the market remains as such into tomorrow and does not sell overnight, we will open up with a gap tomorrow. Of course, we need to get through the payrolls first. Anyway, a new high would be counted as below in red. It will force me then to adjust the black count.
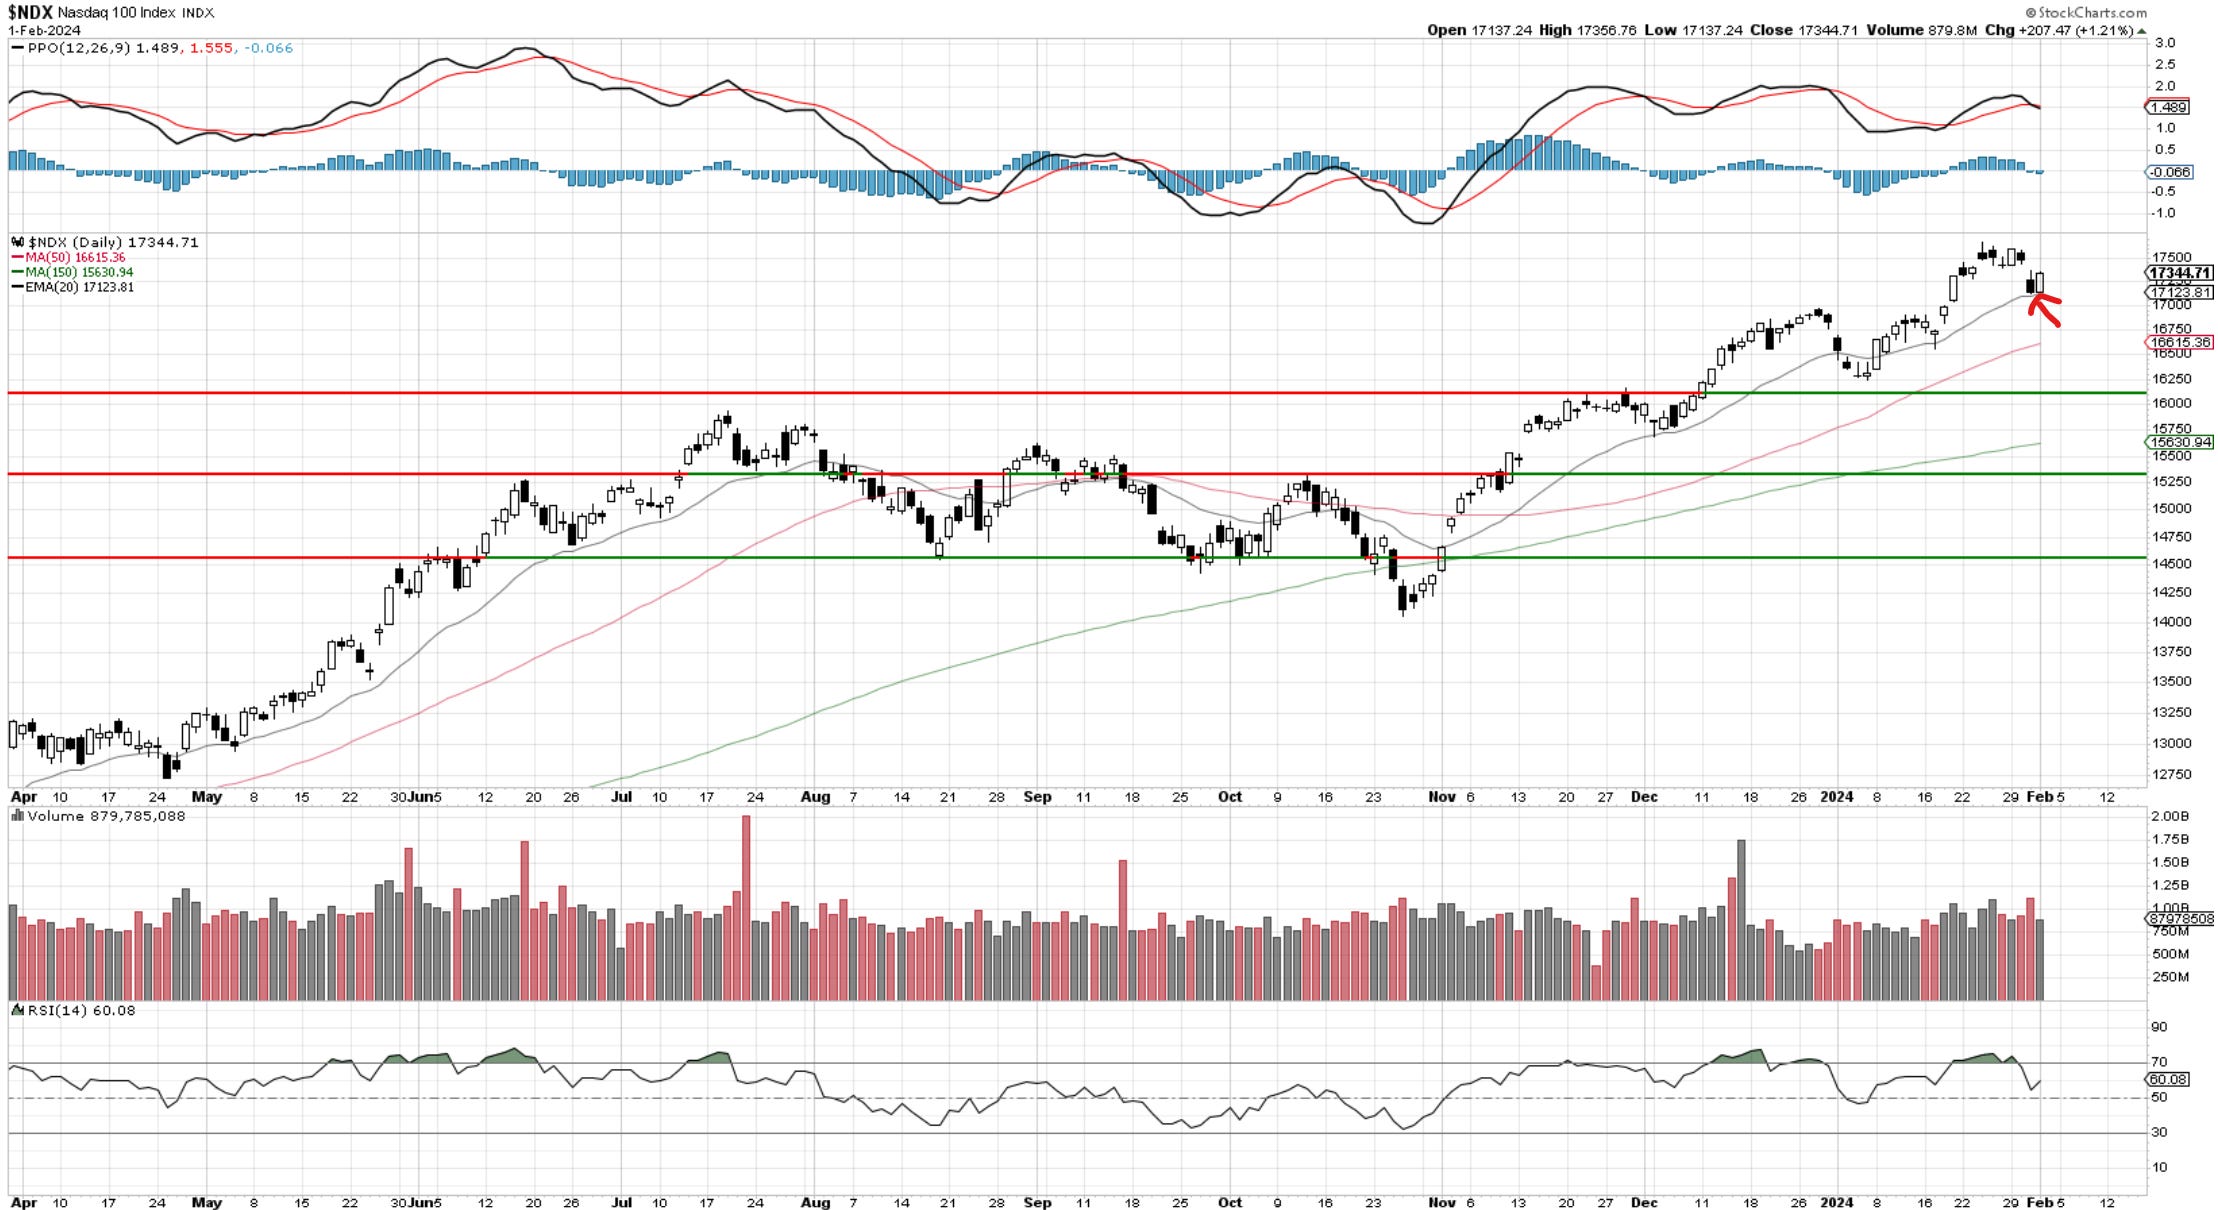
That 20-day MA is good, isn’t it? Trading programs probably love it.
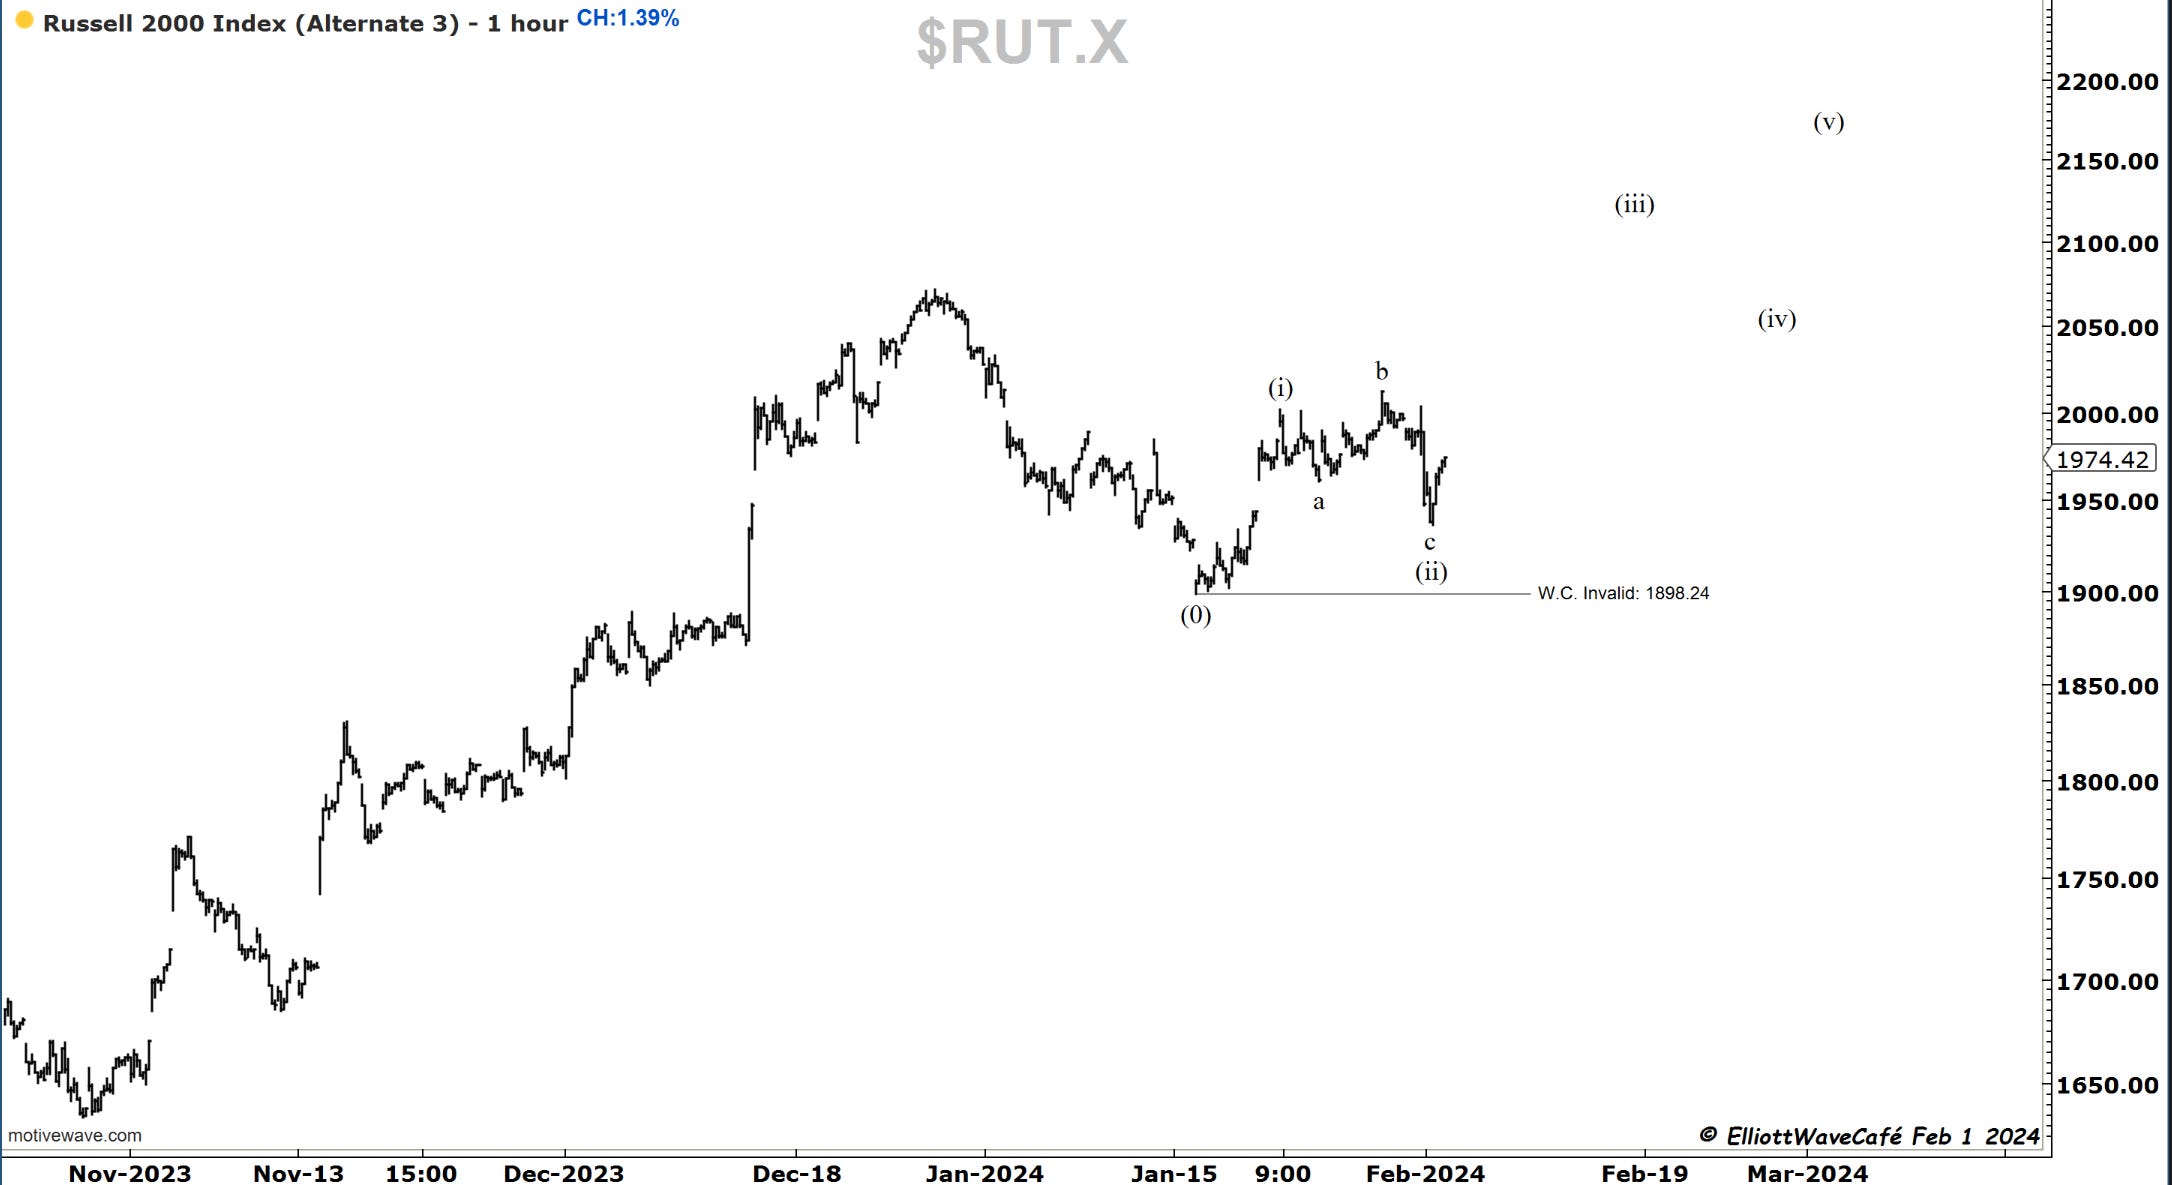
RUSSELL 2000
No major changes here, even after a +1.39% rally. Once above 2000, we can think once again of a wave (iv) completion.
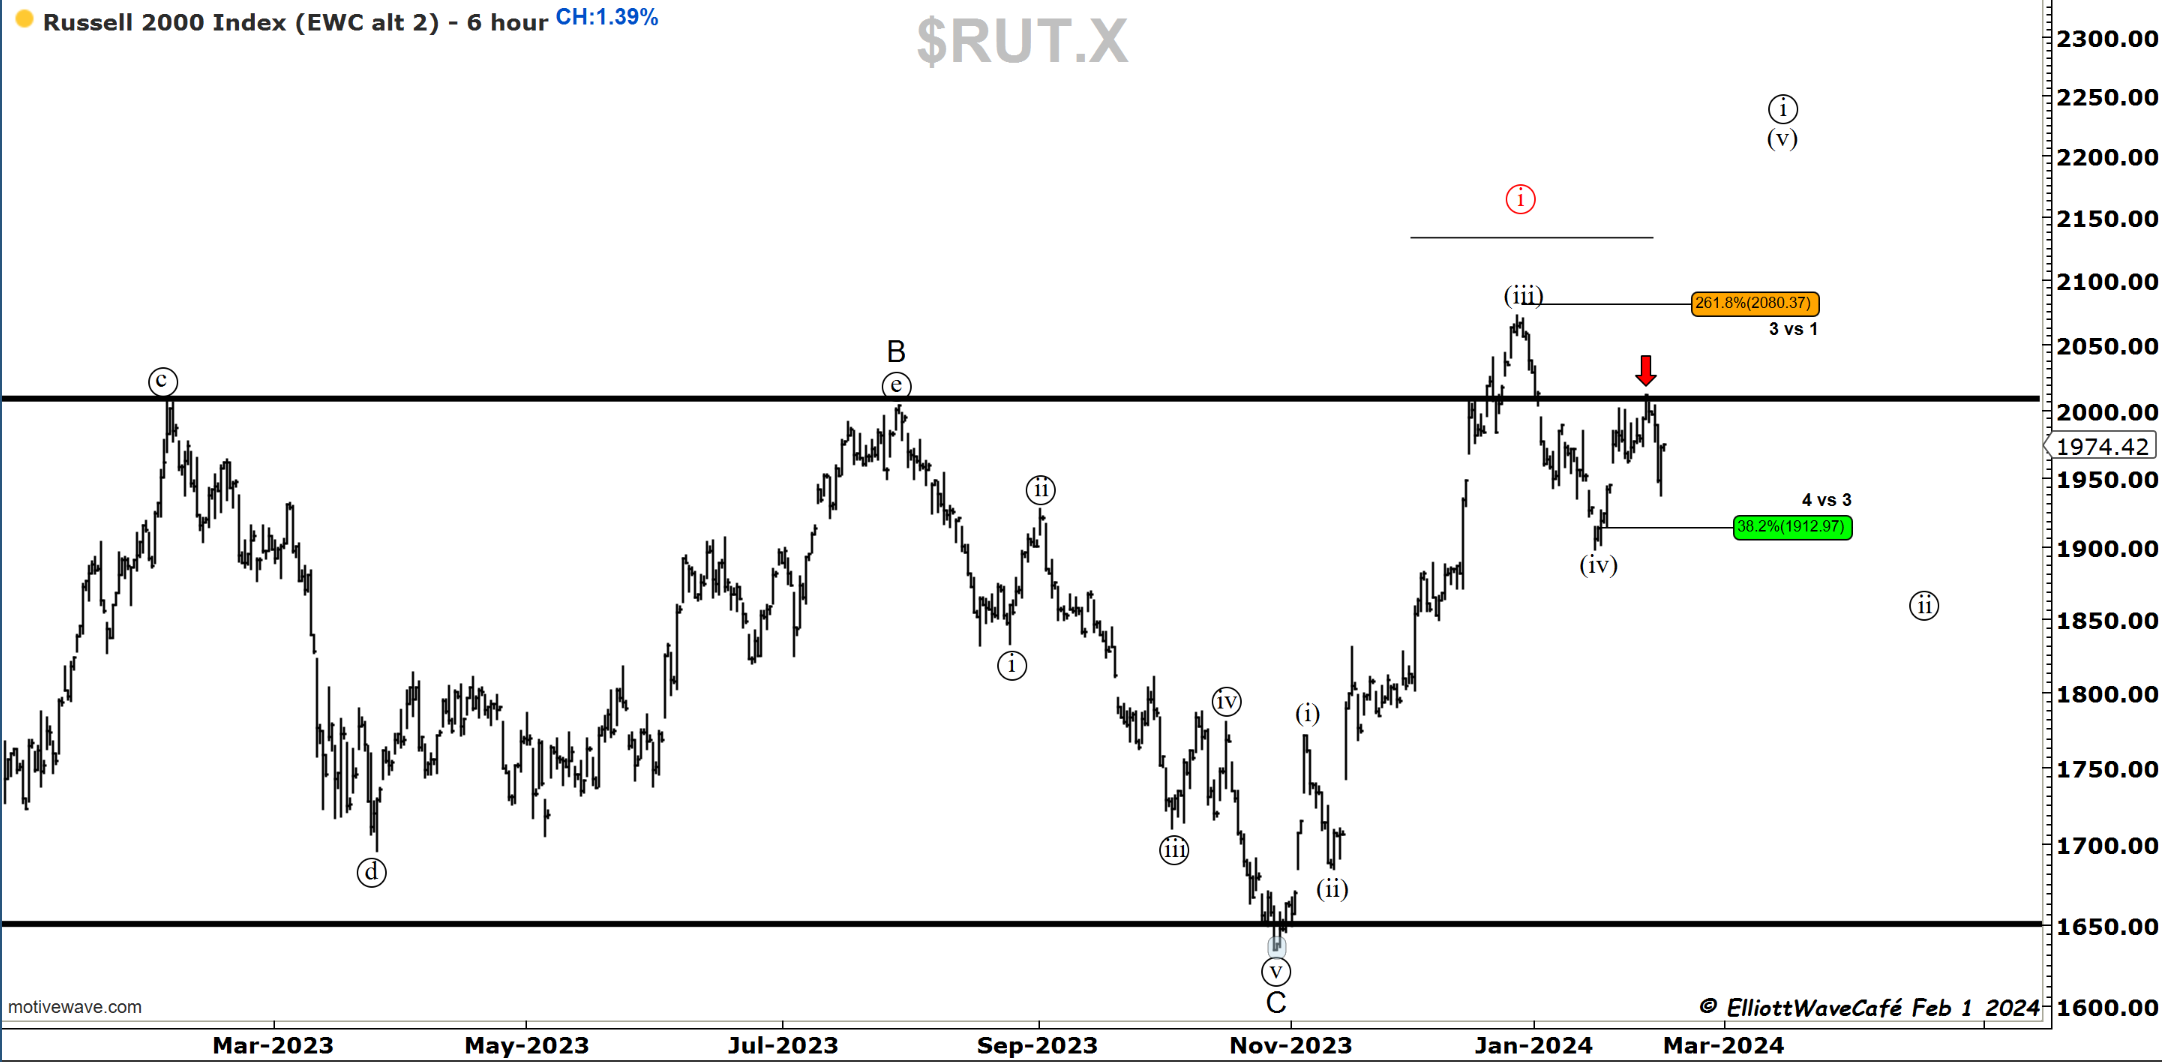
Someone who wants to take a bullish bet here can spot a possible flat in wave (ii) with clear invalidation.

Dow30
Old resistance becomes support, one of the simplest observations in technical analysis. The Dow bounced of 38,109 level for a +0.97% gain. The quick penetration of wave i top damages the impulsive count but can keep the motive count via a diagonal if we make a new high. A quick reminder for all you eliott wave lovers. Motive waves are 2 kinds: impulses and diagonals. All in 5 waves. In impulses, no overlap is allowed. In diagonals is required. As simple as that.
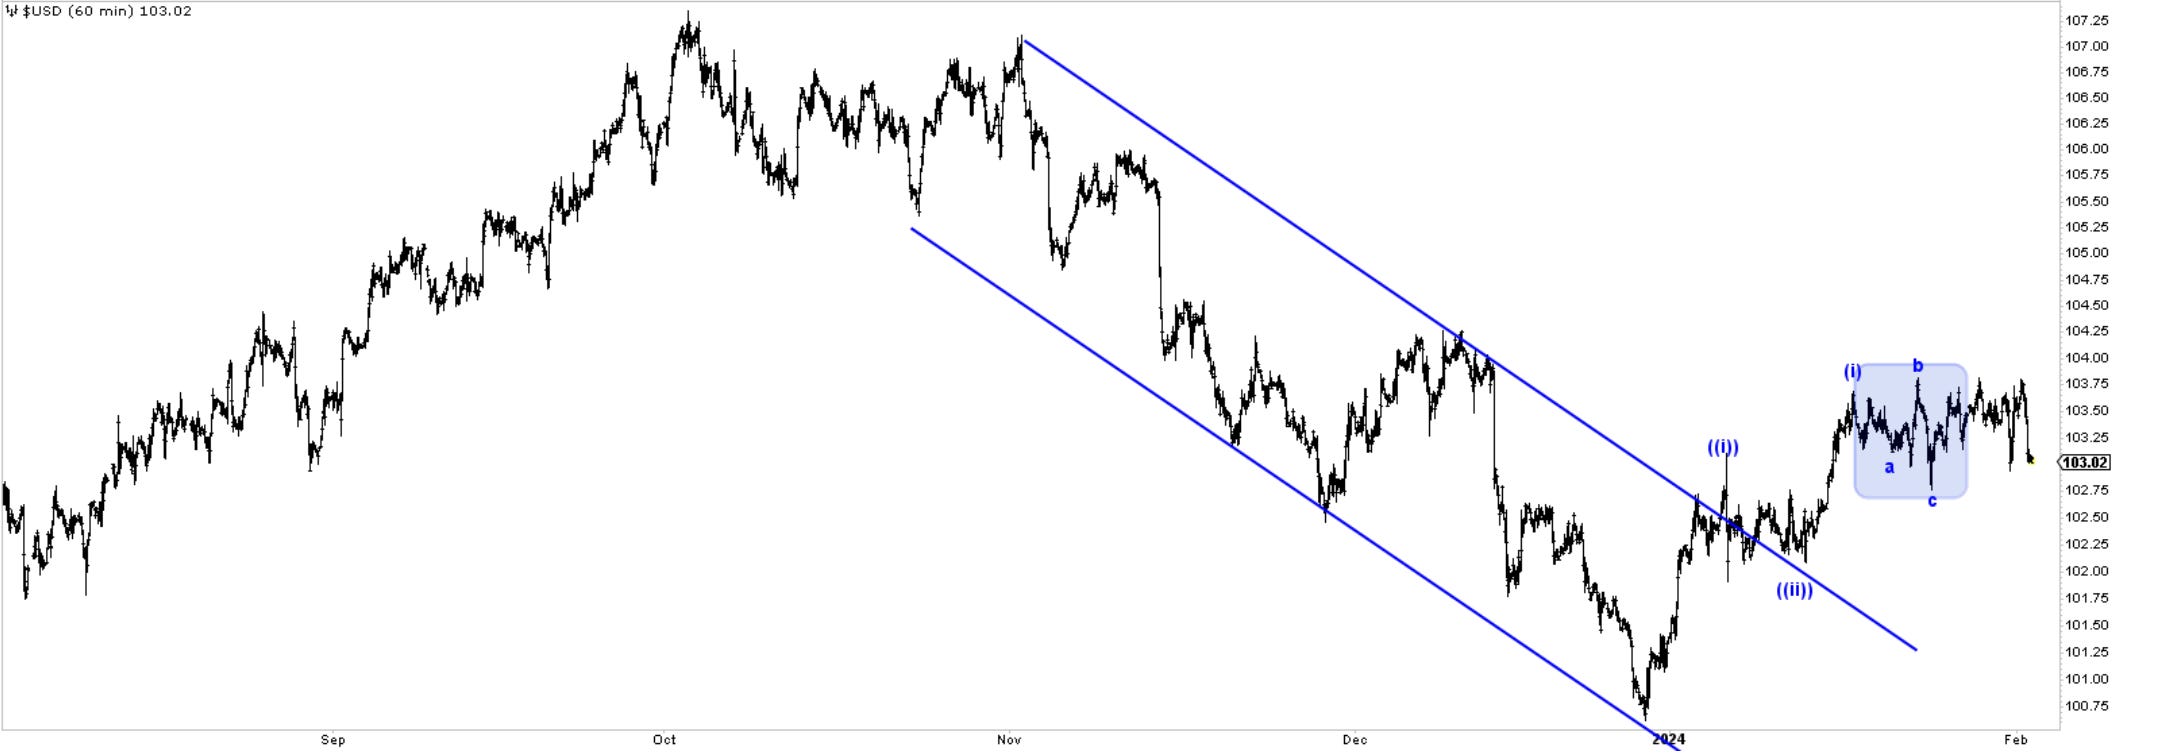
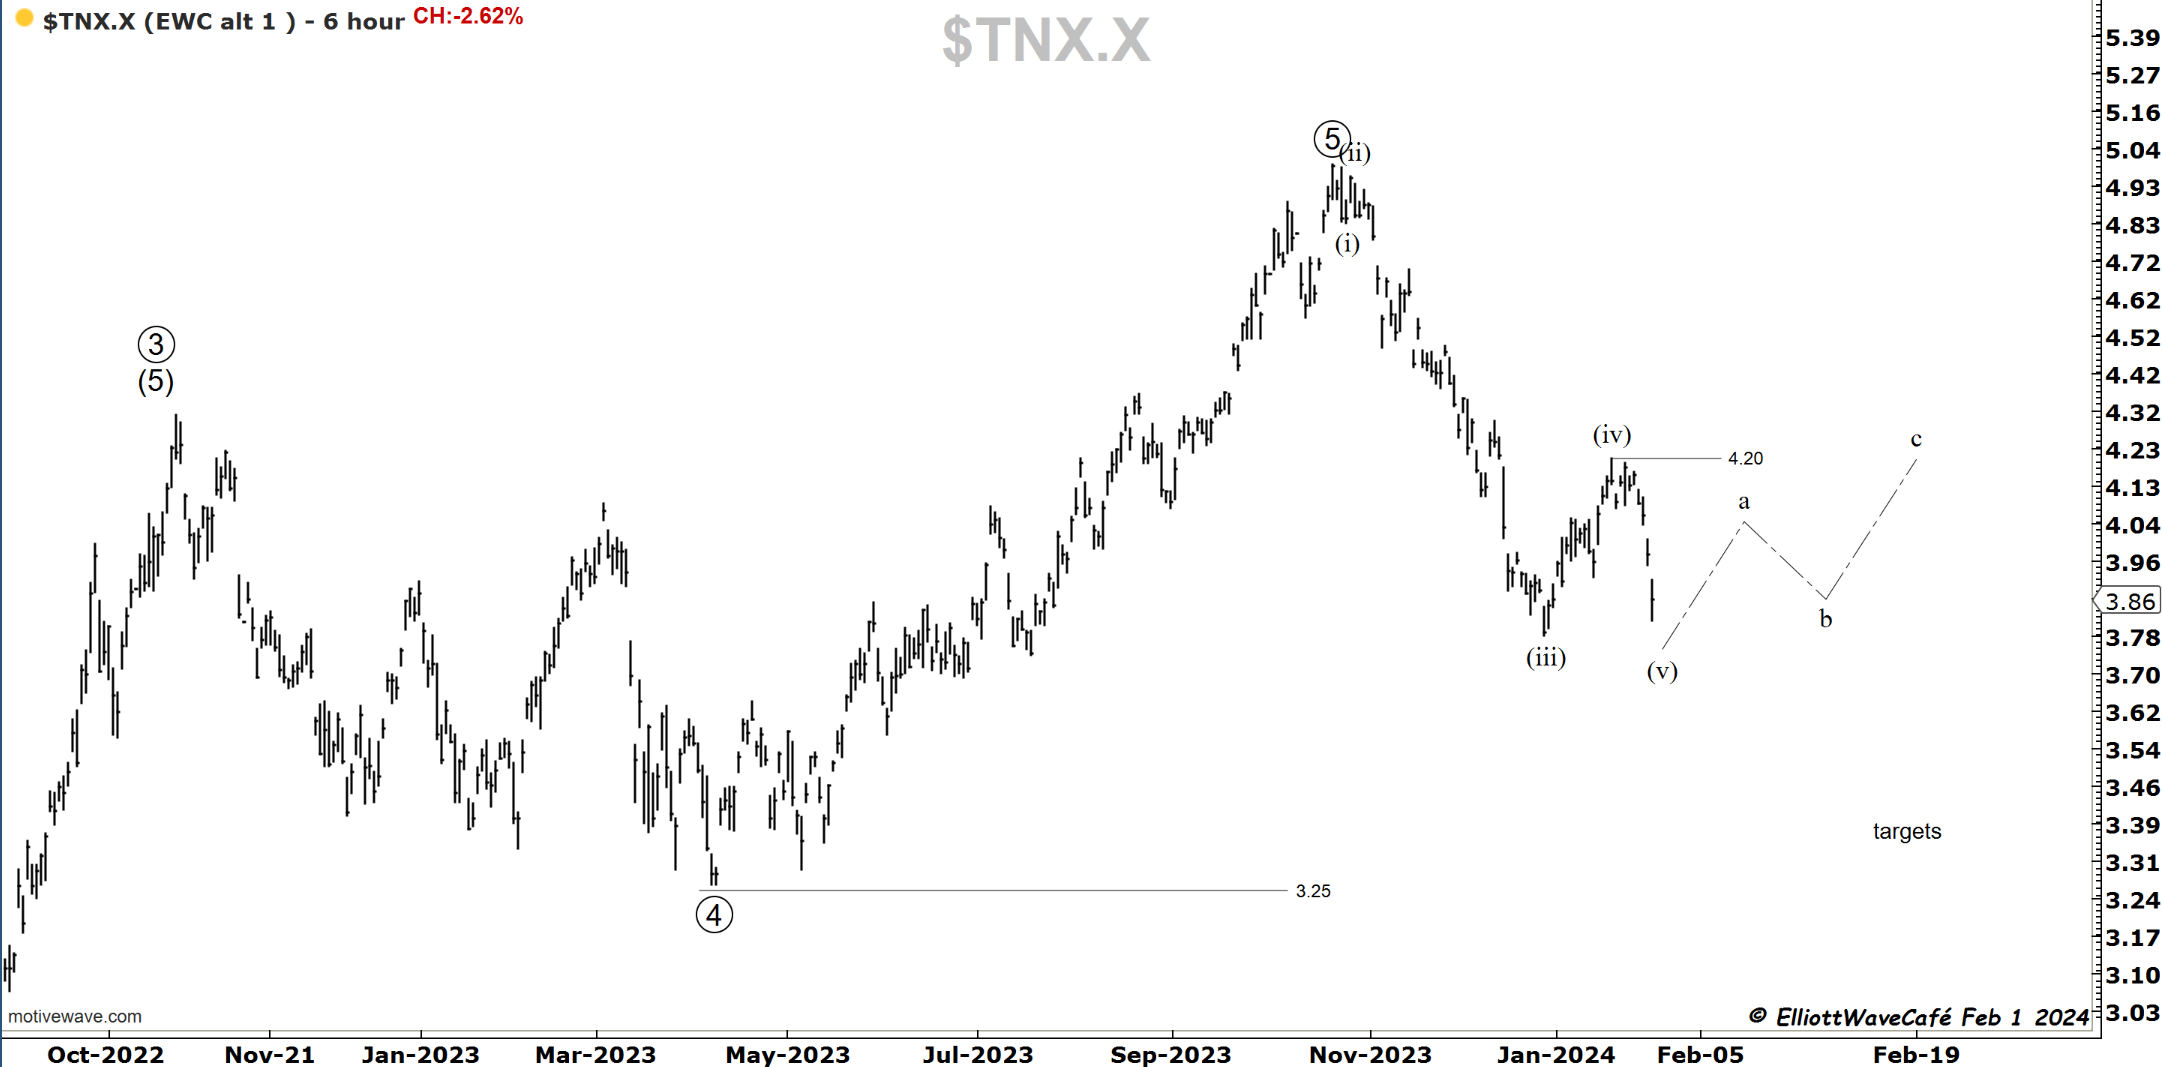
US Dollar and Yields
What’s going on with the dollar here? You tell me.
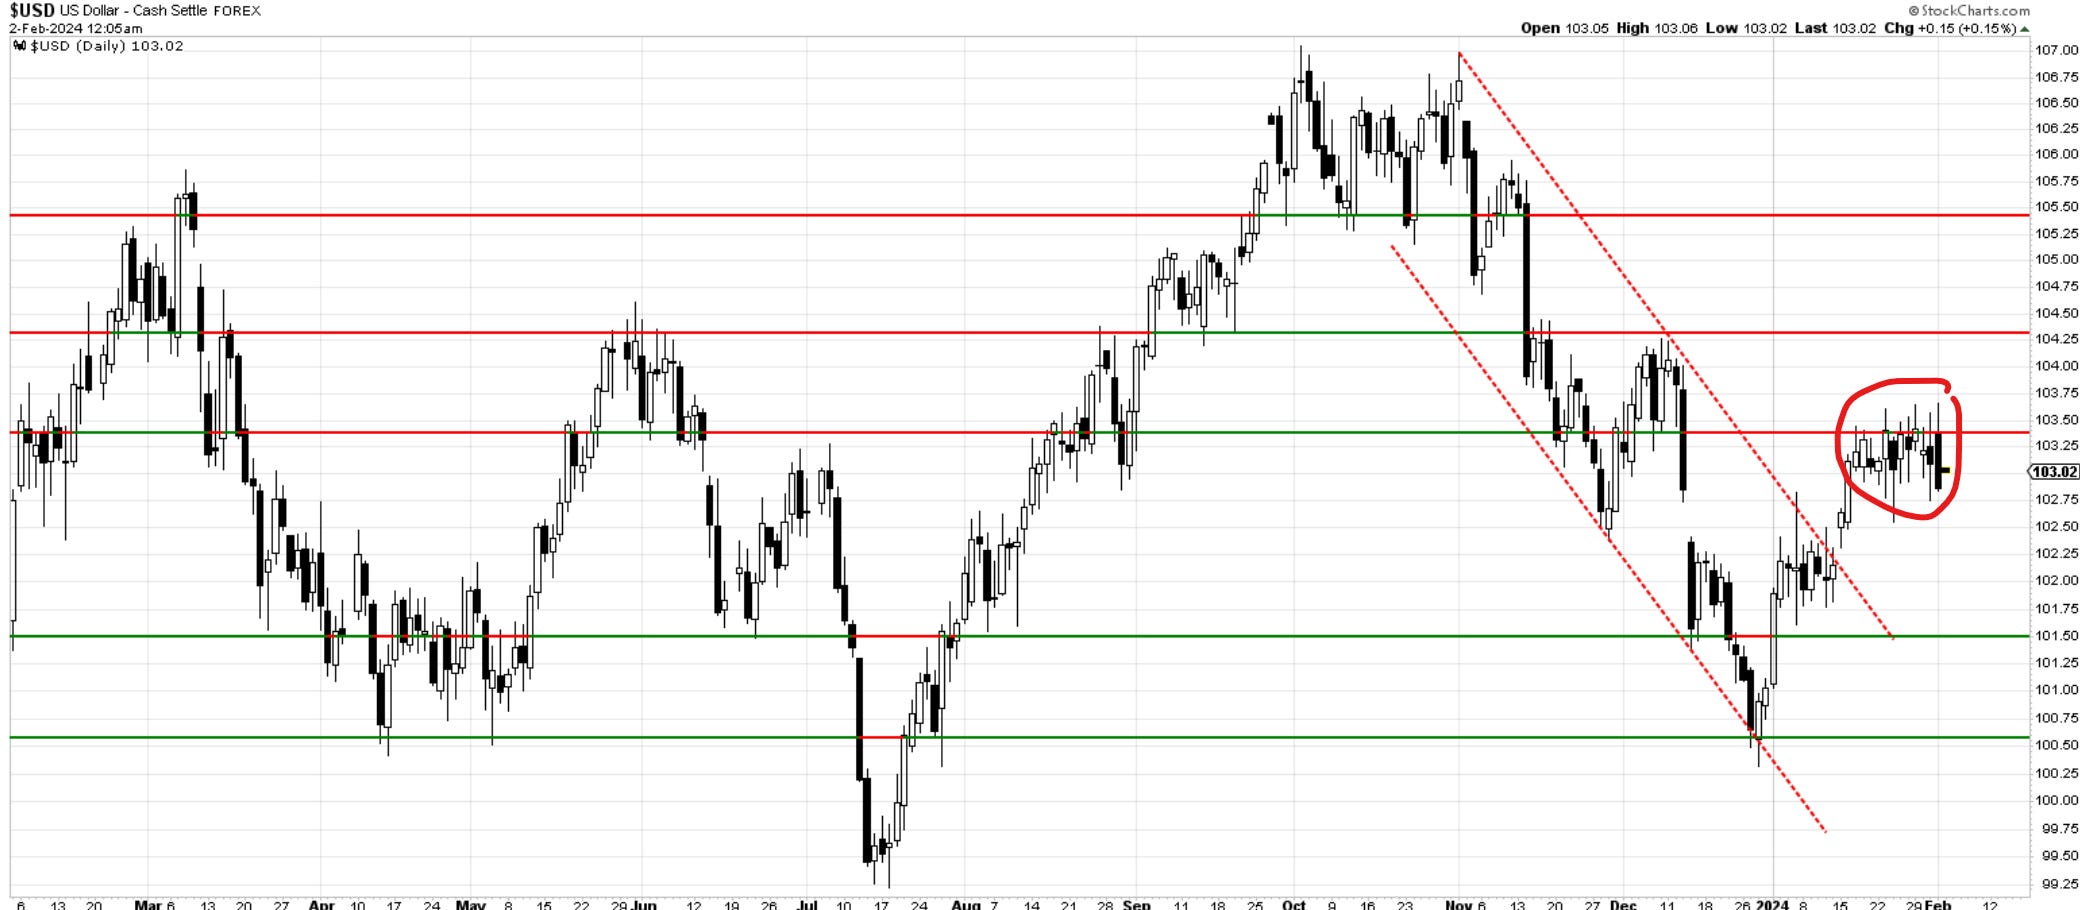
Remember this? Have fun labeling that mess. One thing that appears a bit clearer is that it is tough to count impulsive from Dec lows. Will revisit next week.
That was indeed a 3wave rally into 4.20. I thought it was going to be running slightly higher, but it never did. The move lower is sharp and comes at a time when the Fed says there is likely no rate cut in March. Weird move lower. What does the bond market hint at? It’s quite possible it was a wave (v) to get people bearish yields only to be followed by the real correction higher back above 4.20%. It would be in line with the FED and the cycles shown in previous issues.
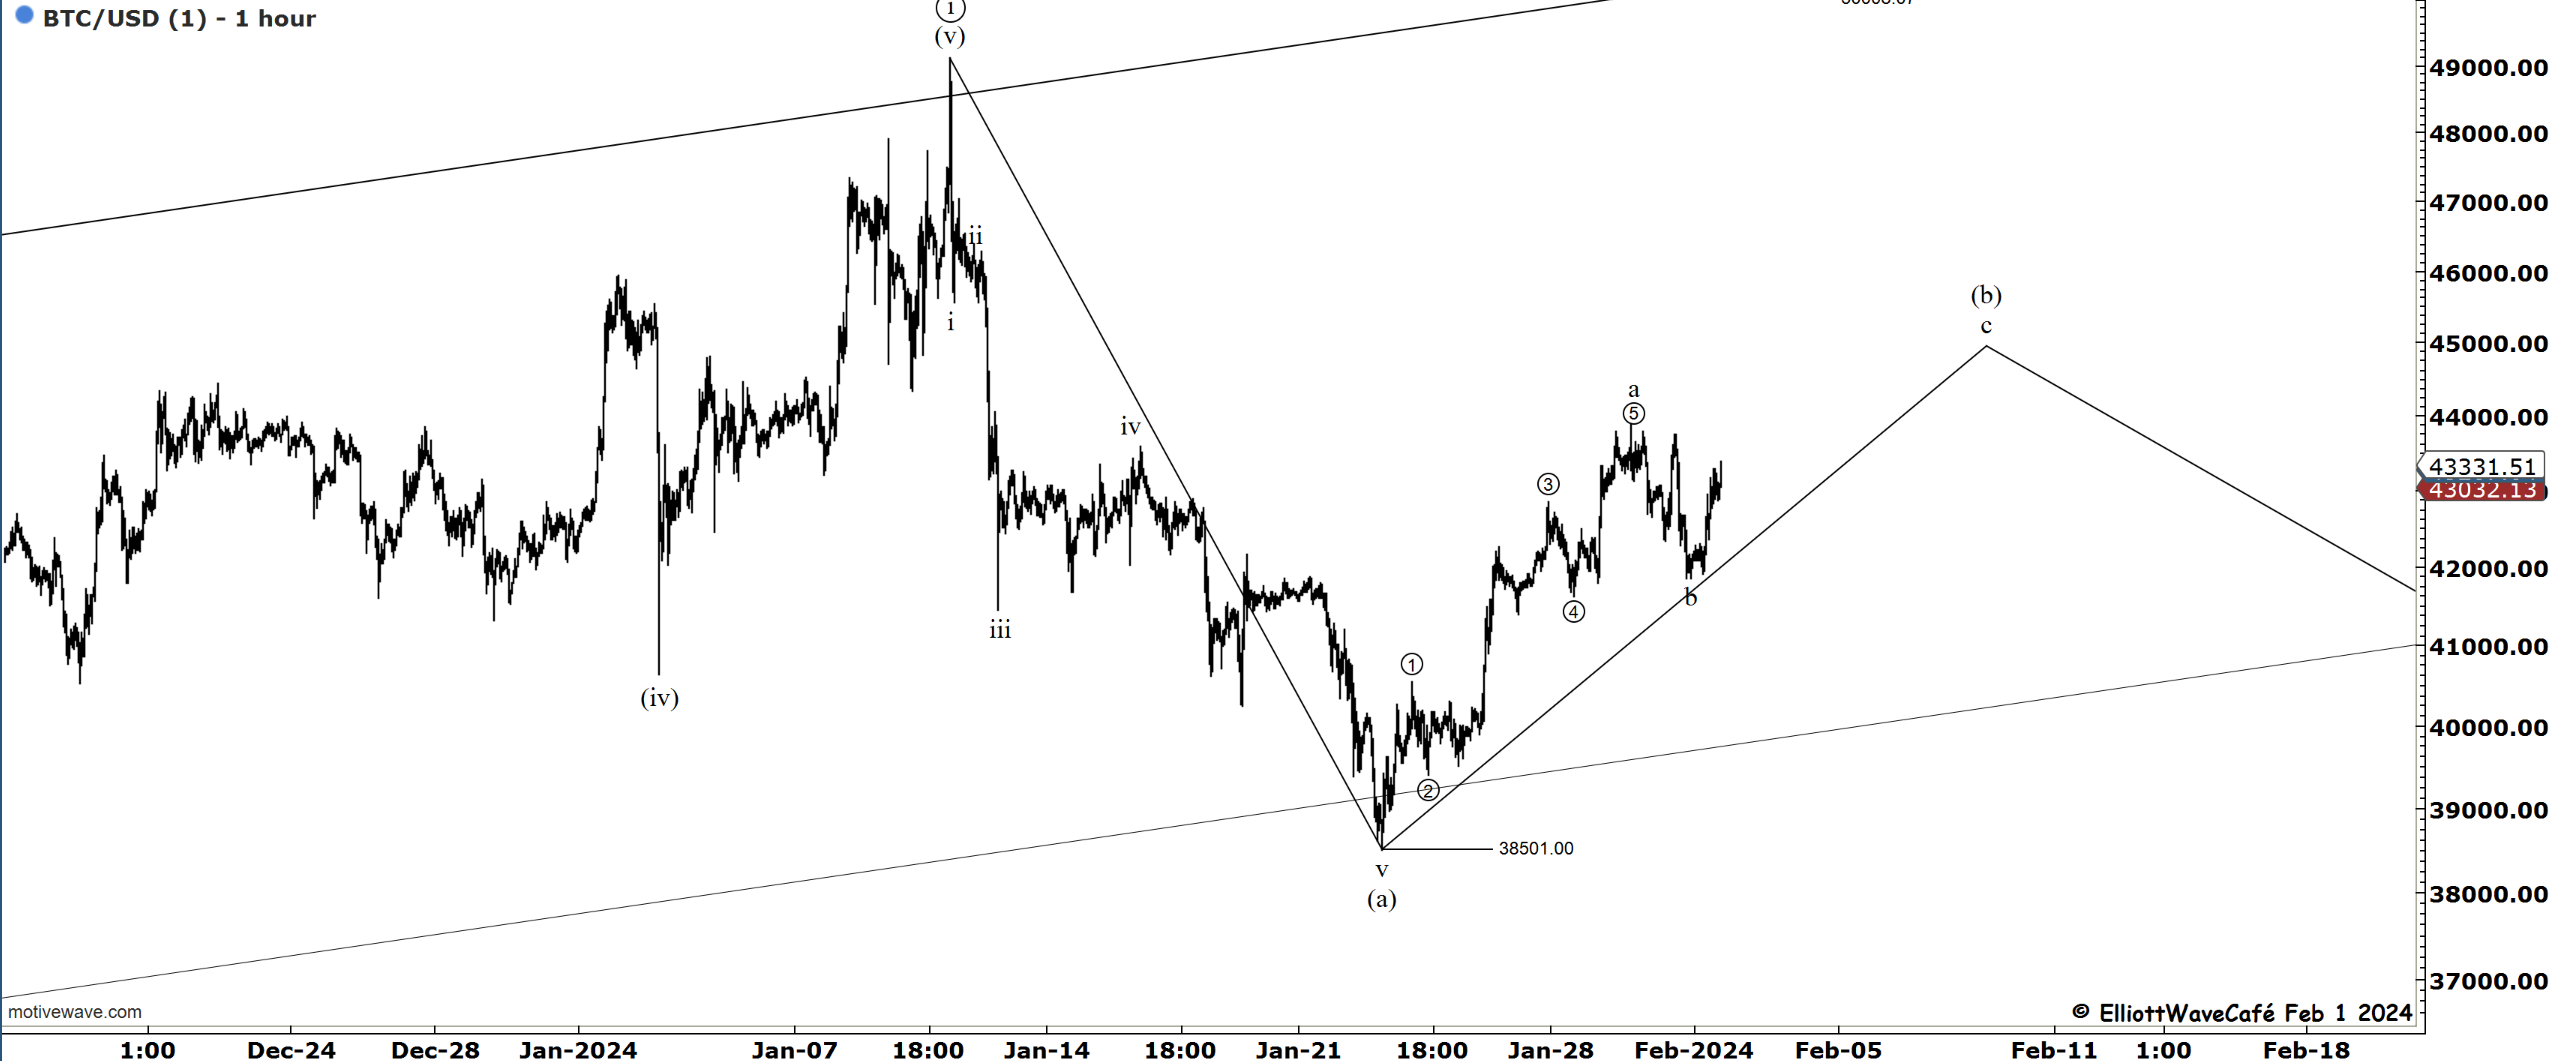
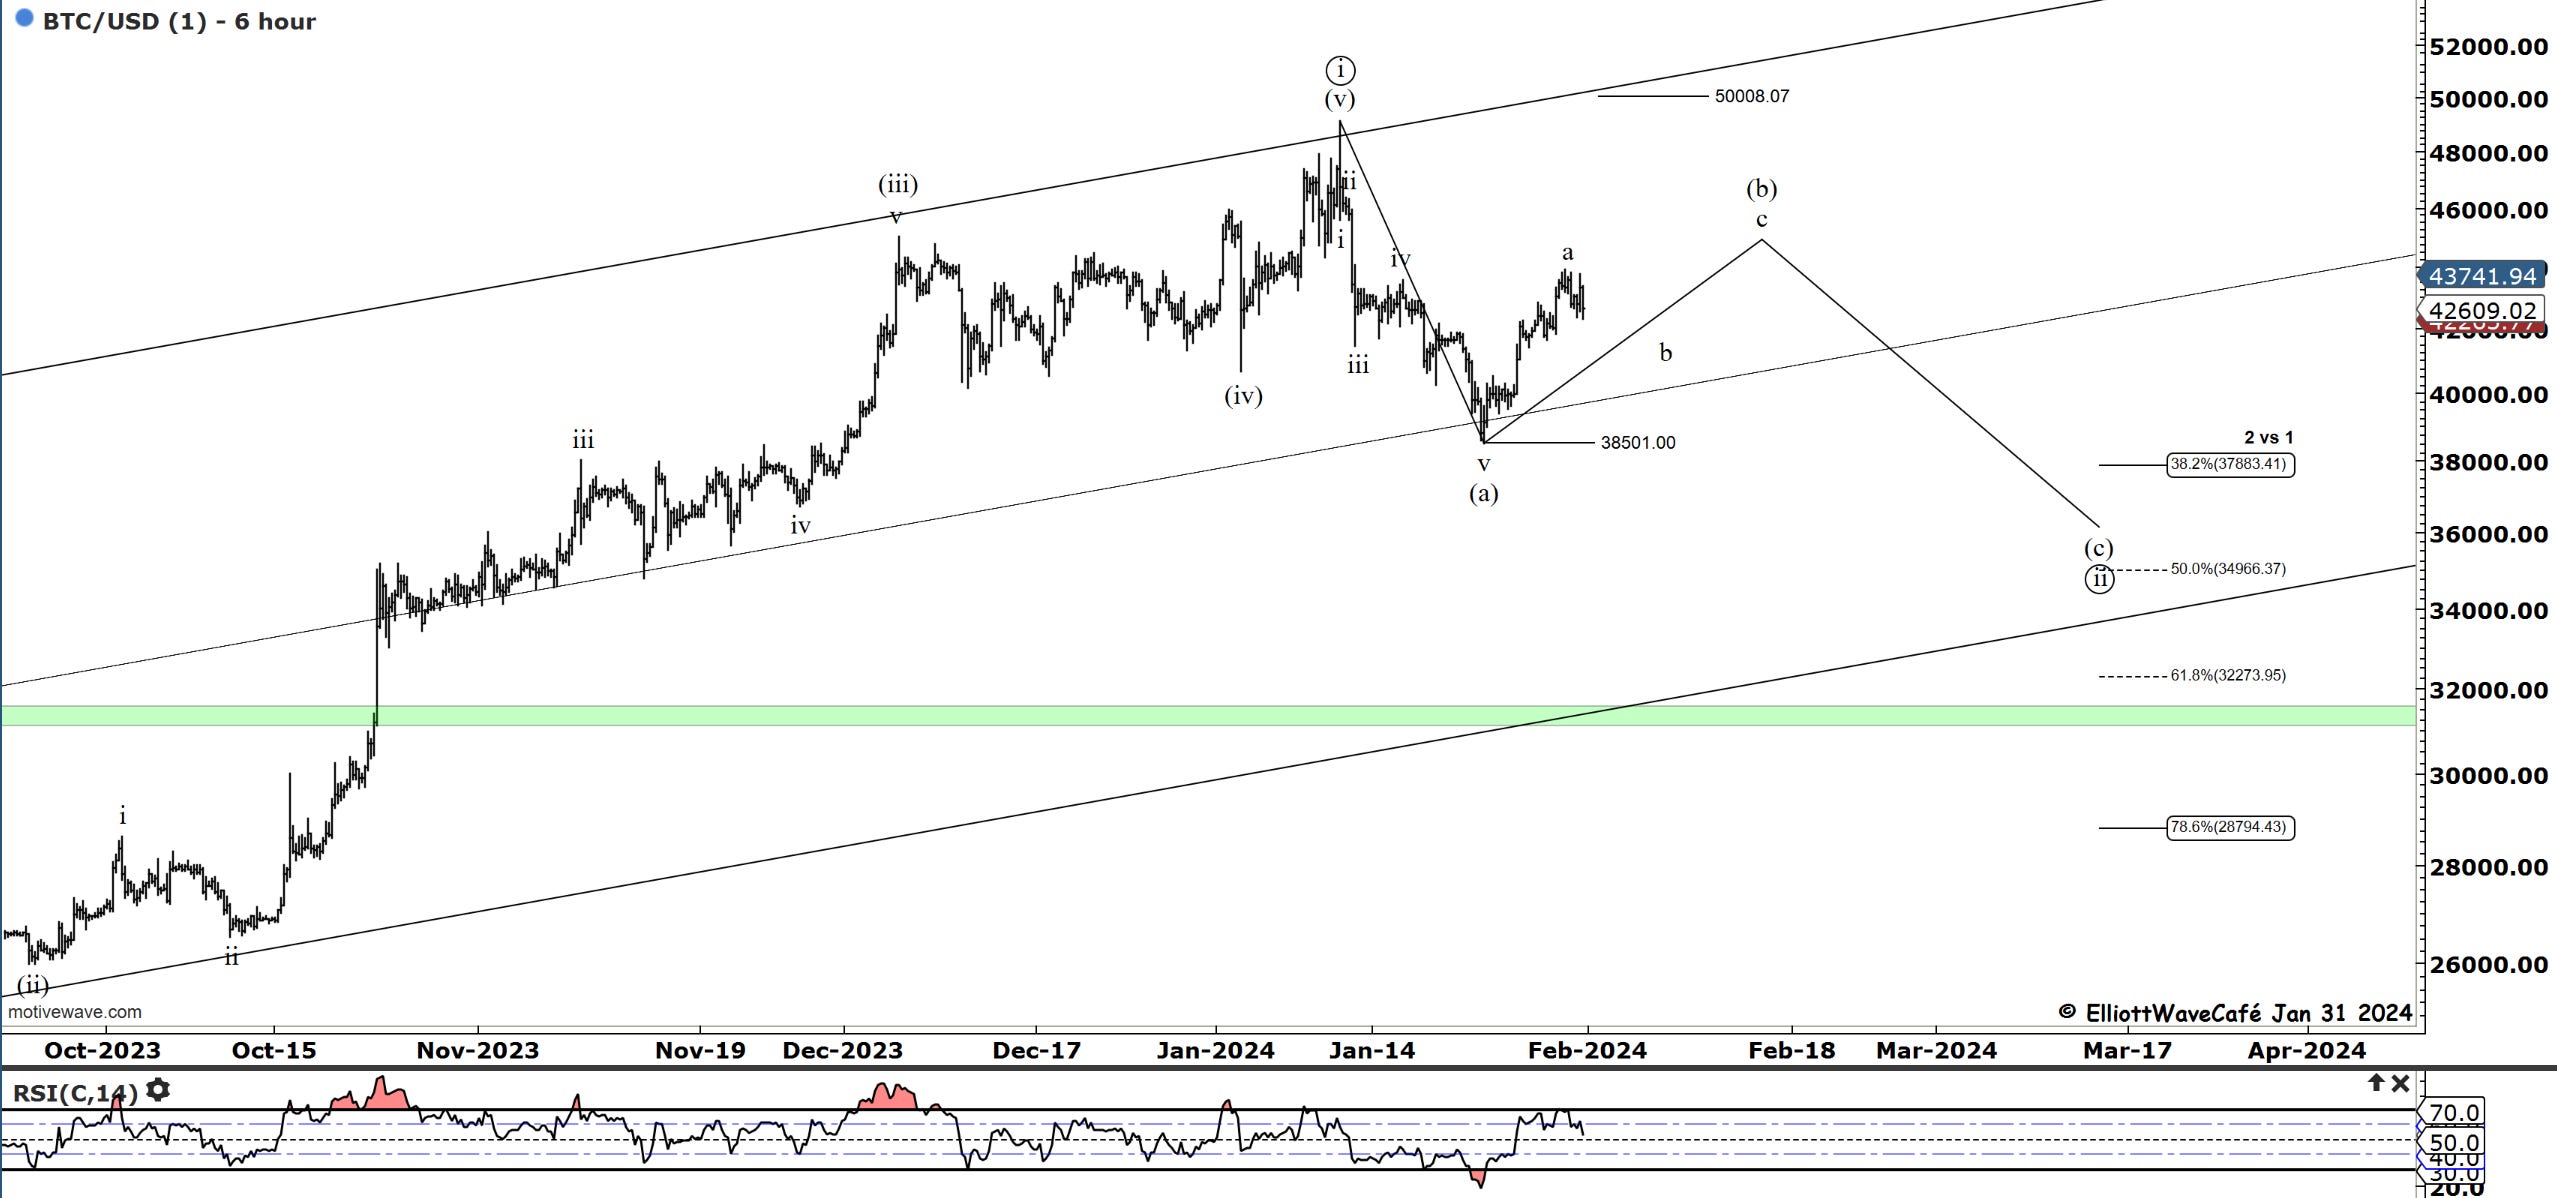
Bitcoin
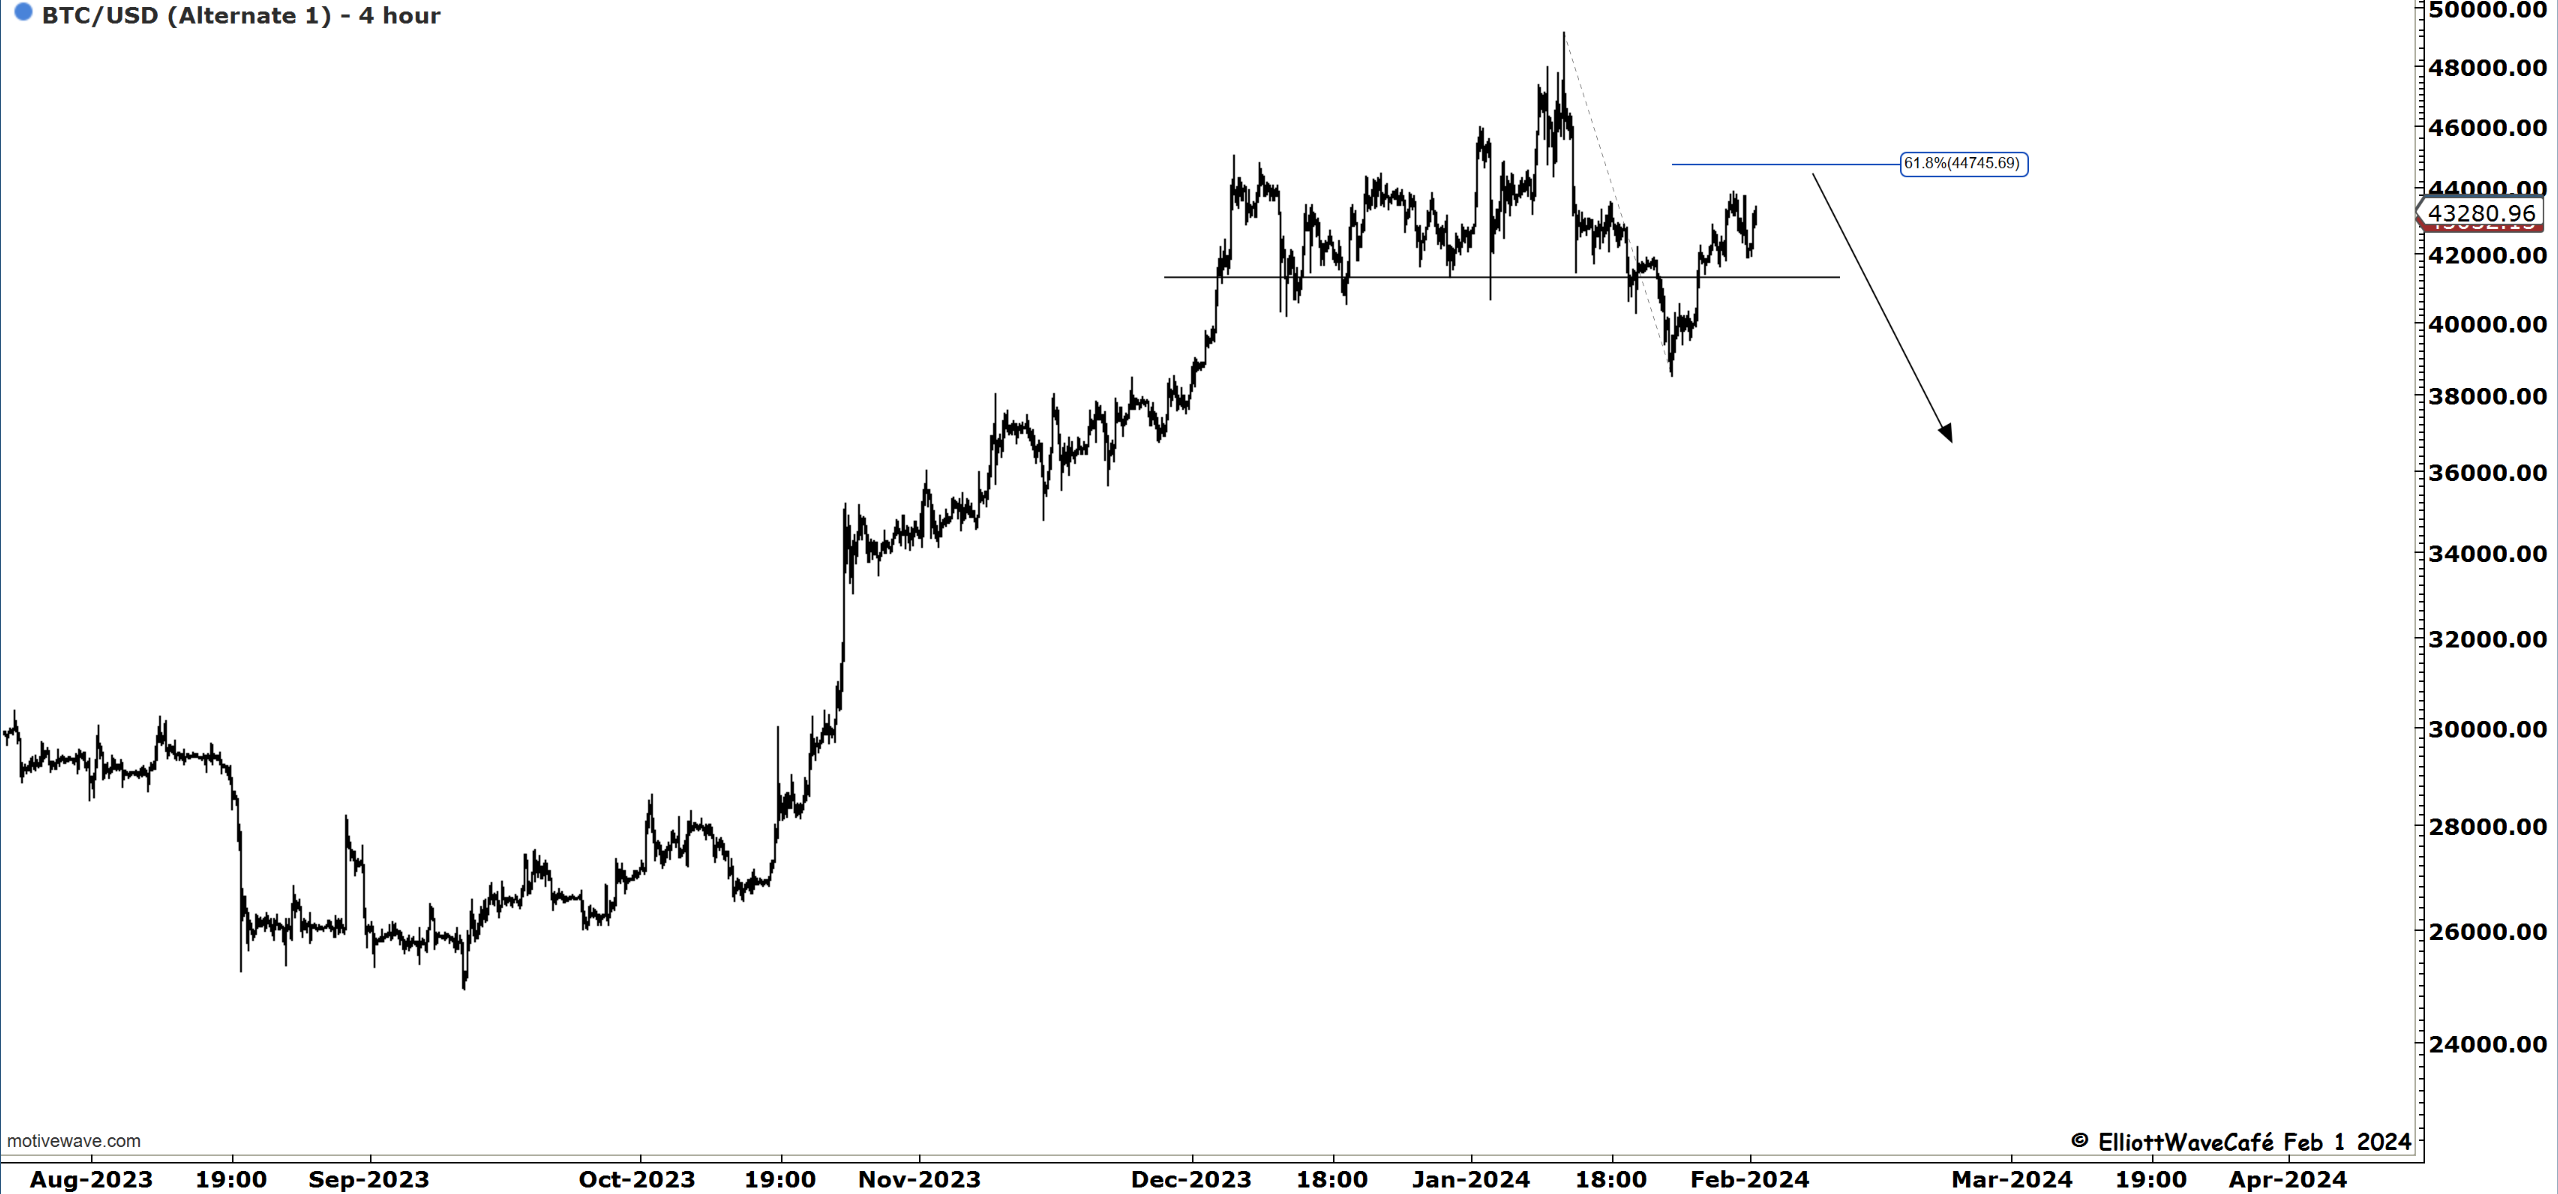
It seems that the move from Jan 23rd higher is a decent impulse. We dropped in three waves since my wave a placement. Was this the entirety of Wave b's decline? If yes, be on the lookout for a move towards 45k next, then a decline again. Somewhere up there, we should hold the advance. If we don’t, please refer to the fourth chart.
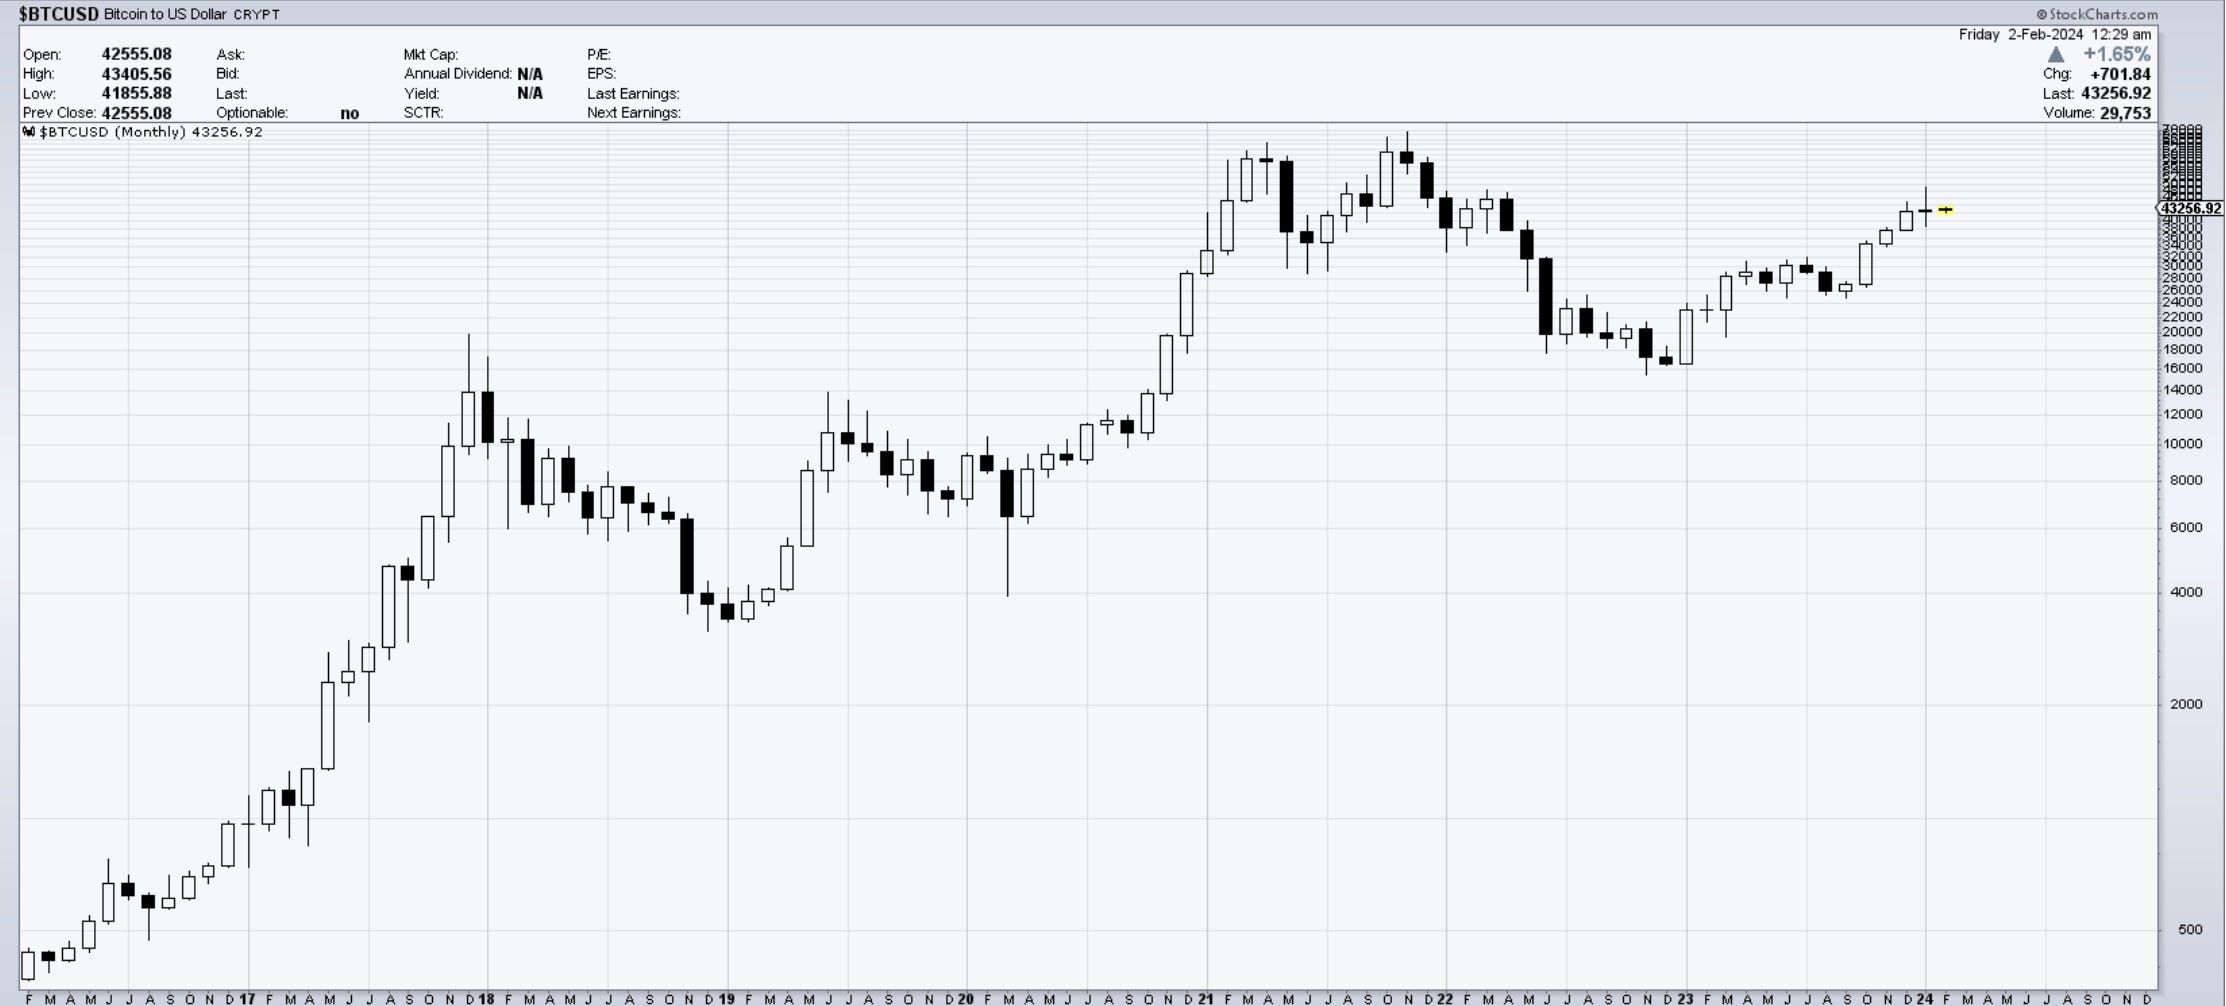
Should we be concerned about a monthly doji candle after a 4-month rally? Maybe it's just a pause in trend.
“Double shot” Daily member video coming up next,
If you’re new to Elliott Wave or need to refresh, there is a 7-hour video course with downloadable slides under The Coarse tab on the website.
Have a great day wherever you are! - trade well, and don’t forget to subscribe and drop a like if this letter helps you in any way.
Cris
email: ewcafe@pm.me