
The Daily Drip
Markets review, strategy and analysis
Note: The EW counts on the right edge are real-time, and they are prone to adjustments as price action develops. Elliott Wave has a fluid approach, is evidence-based, and requires constant monitoring of certain thresholds.
In the counts below, this (( )) = circle on chart
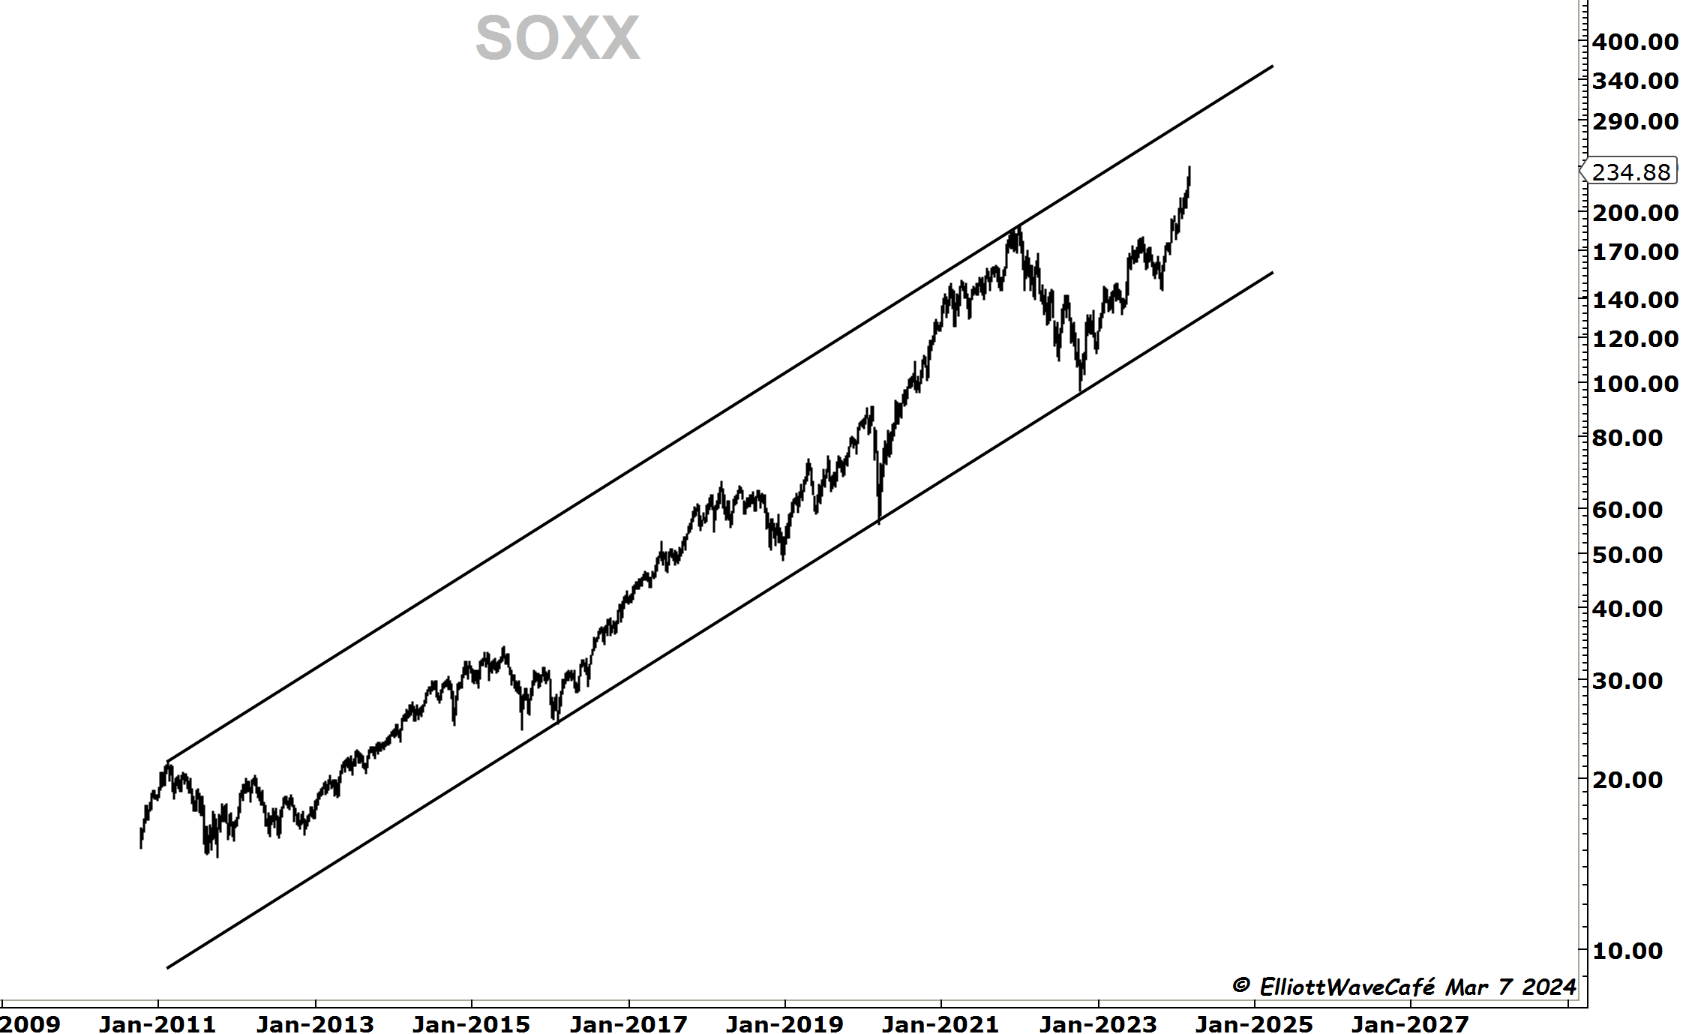
Chart of the Day - SOXX - I have tried arguing with the semiconductors before and I lost that argument. 290 in this index is what she wants.
In yesterday’s note, we discussed how it is tricky to make count assumptions until certain price levels give way, trendline placement and failures, and the historical tendencies of price vs. a key moving average. I showed sentiment signals on DeMark indicators and a clean break we’ve been expecting in the dollar index.
Discussed the impulsive move in Gold and how the count progresses.
In BTC, we went over the counting process and the expectations following a five-wave move. “That wave needs 5 waves within it and needs to be larger and stronger than wave 1 ( most times). Saying where wave ((i)) of wave 3 terminates is a task we’re trying to accomplish. We can see 5 waves from lows in January, but that does not mean we have a top. The market is bullish and until I see wave ((ii) formed to a recognizable form, I would not dare say we have a top in ((i)).” I also showed how much we still need to travel to reach frothy territory as depicted by longer term trends.
The daily video was public and focused on counting the crypto.com Cro coin. You can find that here
An upset chart is a ratio between small caps and spiders. There have been 10 years of outperformance, followed by another 10 of underperformance. Where do we go from here now that we’re re-visiting 2000 lows?
Let’s take a look at the charts below and review SPX, NDX, IWM, DOW, DXY, GOLD, and BTC, along with some other fun charts we can get our hands on.
Daily video following as well…
