
The Daily Drip
Core markets charts updates and commentary
Note: The counts on the right edge are real-time, and they are prone to adjustments as price action develops. Elliott Wave has a fluid approach, is evidence-based, and requires constant monitoring of certain thresholds.
In the counts below, this (( )) = circle on chart
SP500
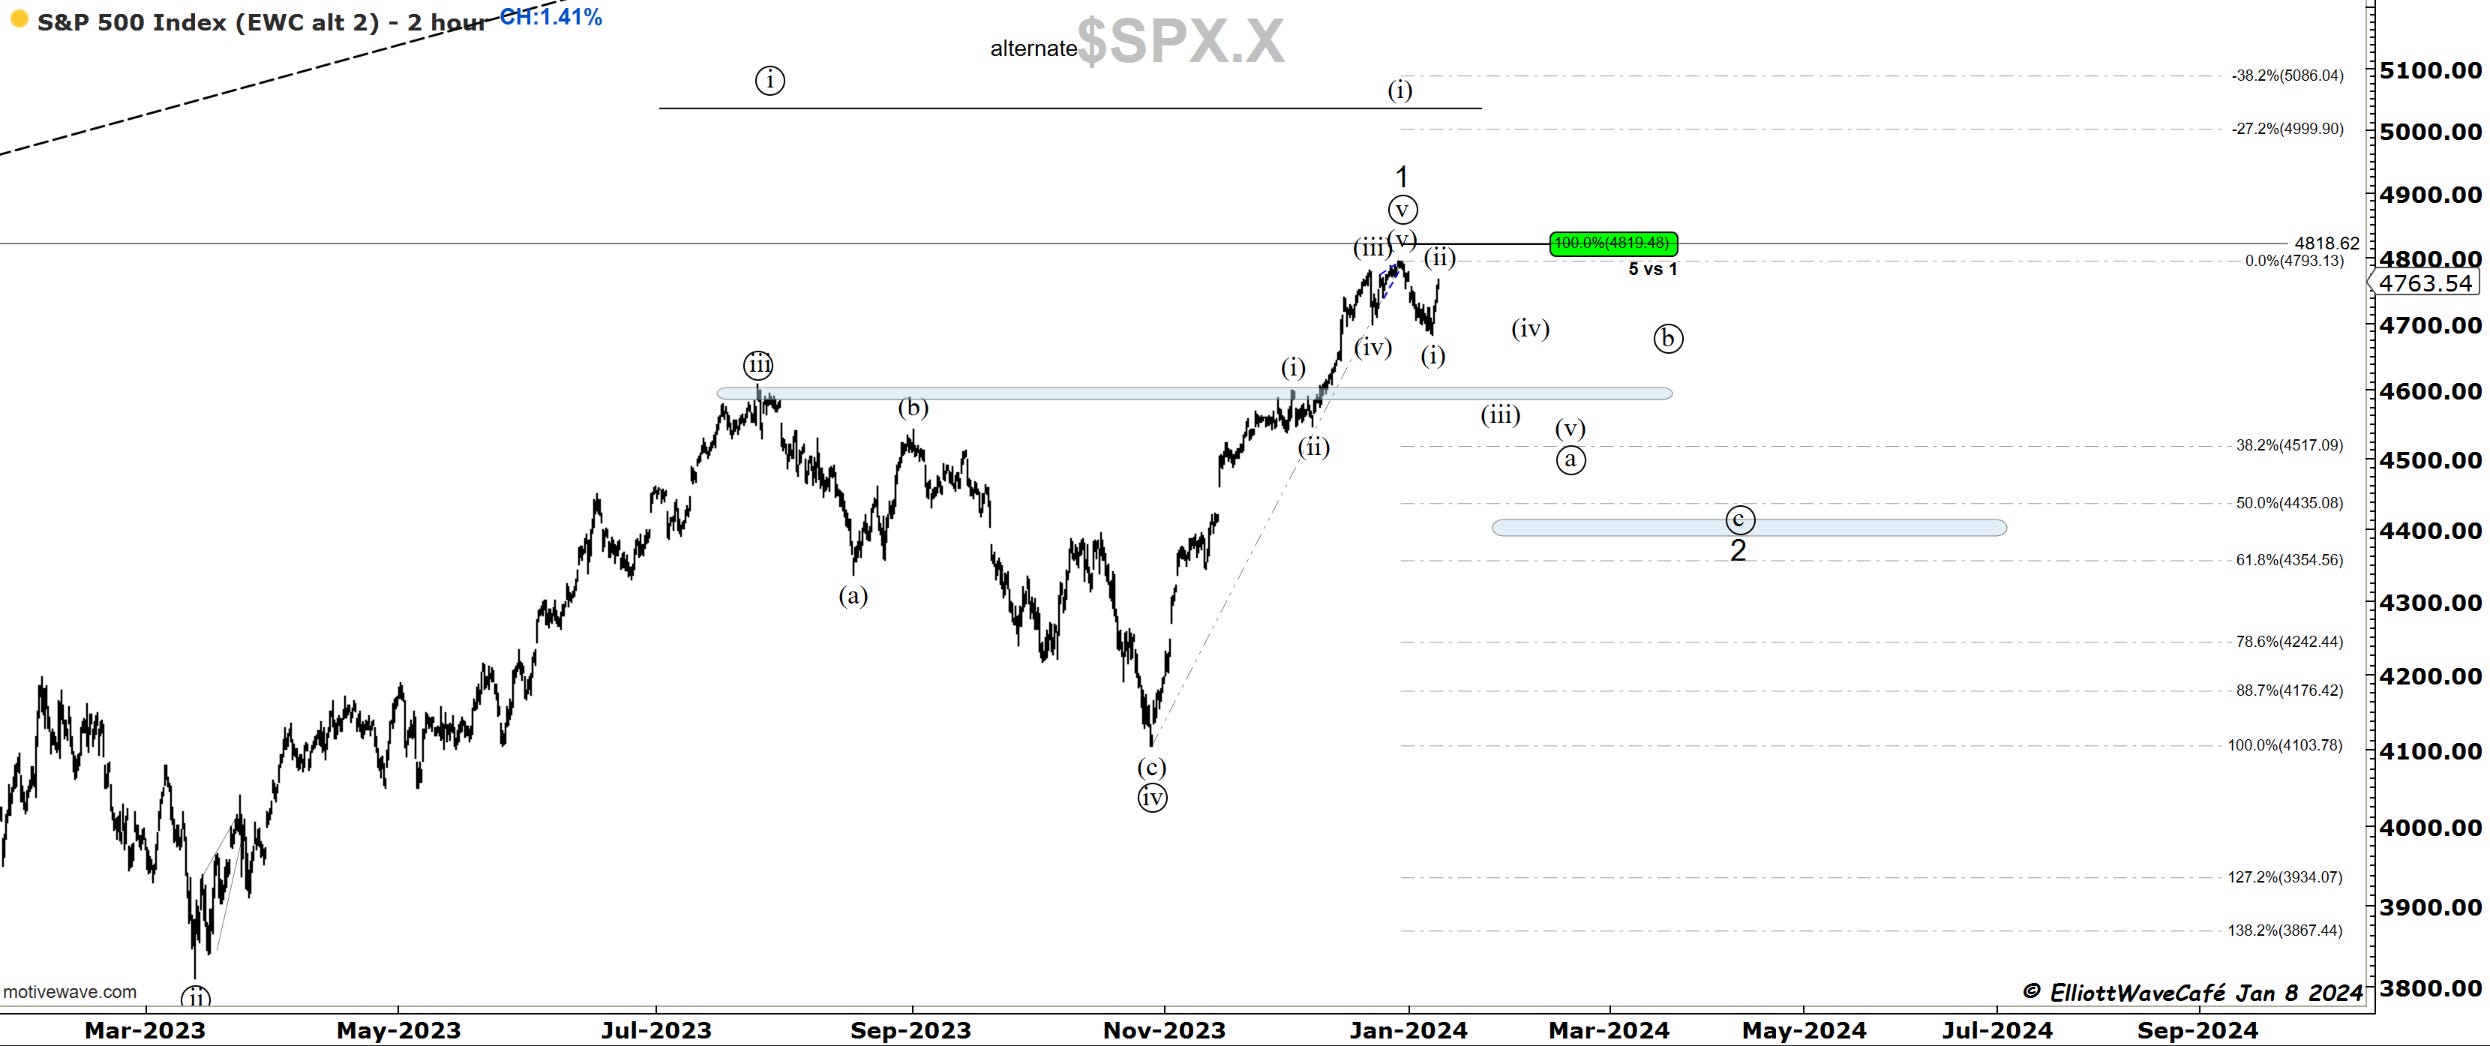
With the climb above 4730 today, the initial decline from 4790 can be confirmed as completed. That was either wave (i) or (a) of a suggested larger wave 2 pullback. The current rally is either wave (ii) or a of (ii). Without getting above 4790, the expectation would be for the next impulse to be lower towards 4600.
.
Nasdaq100
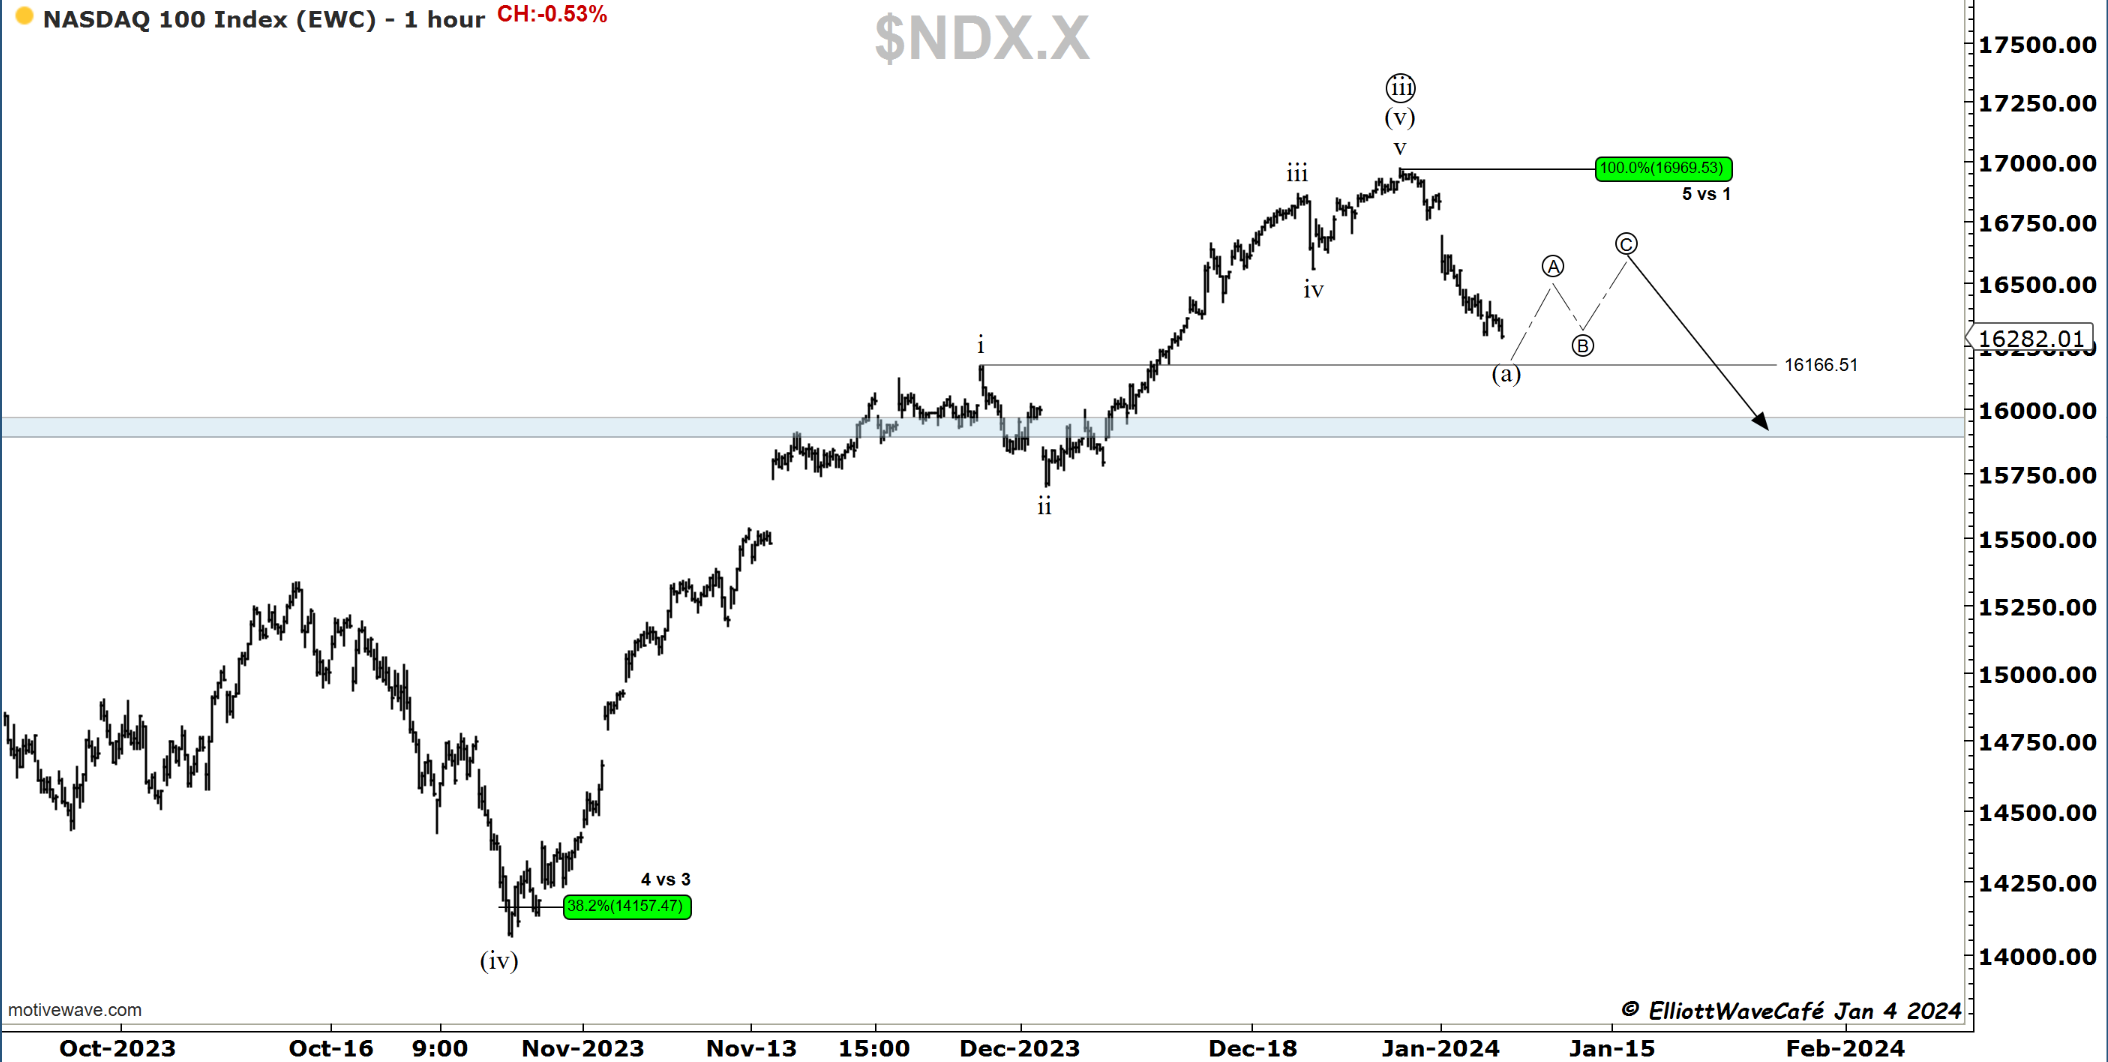
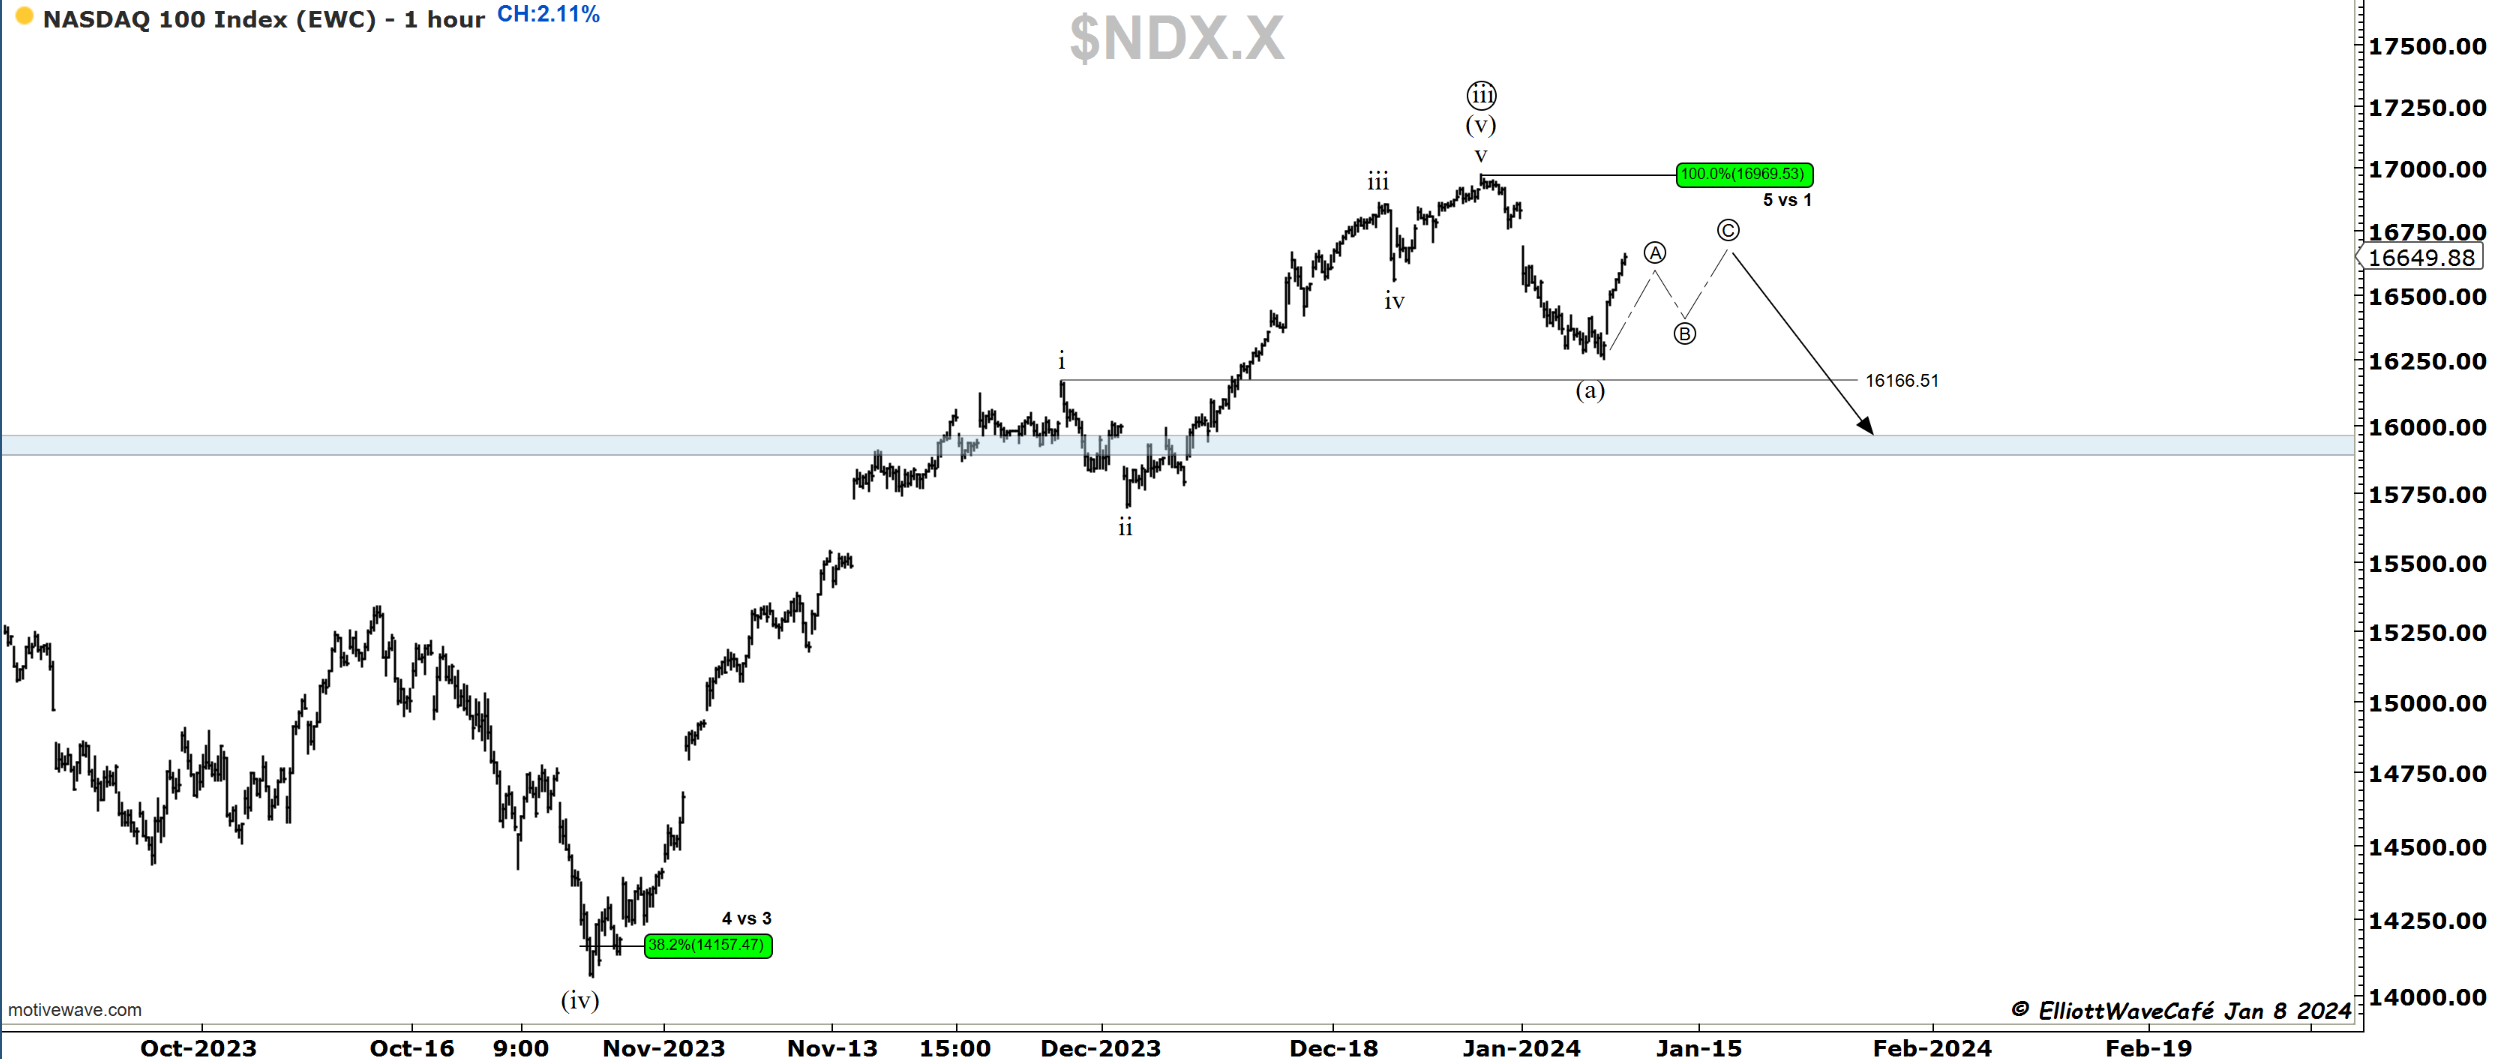
The rally in Nasdaq is taking place as expected, with a wave reaction upwards after the initial motive wave decline. It appears that only wave ((A)) upwards has taken place unless we’re dealing with a flat. In either case, we will be resuming lower in one additional impulse.
RUSSELL 2000
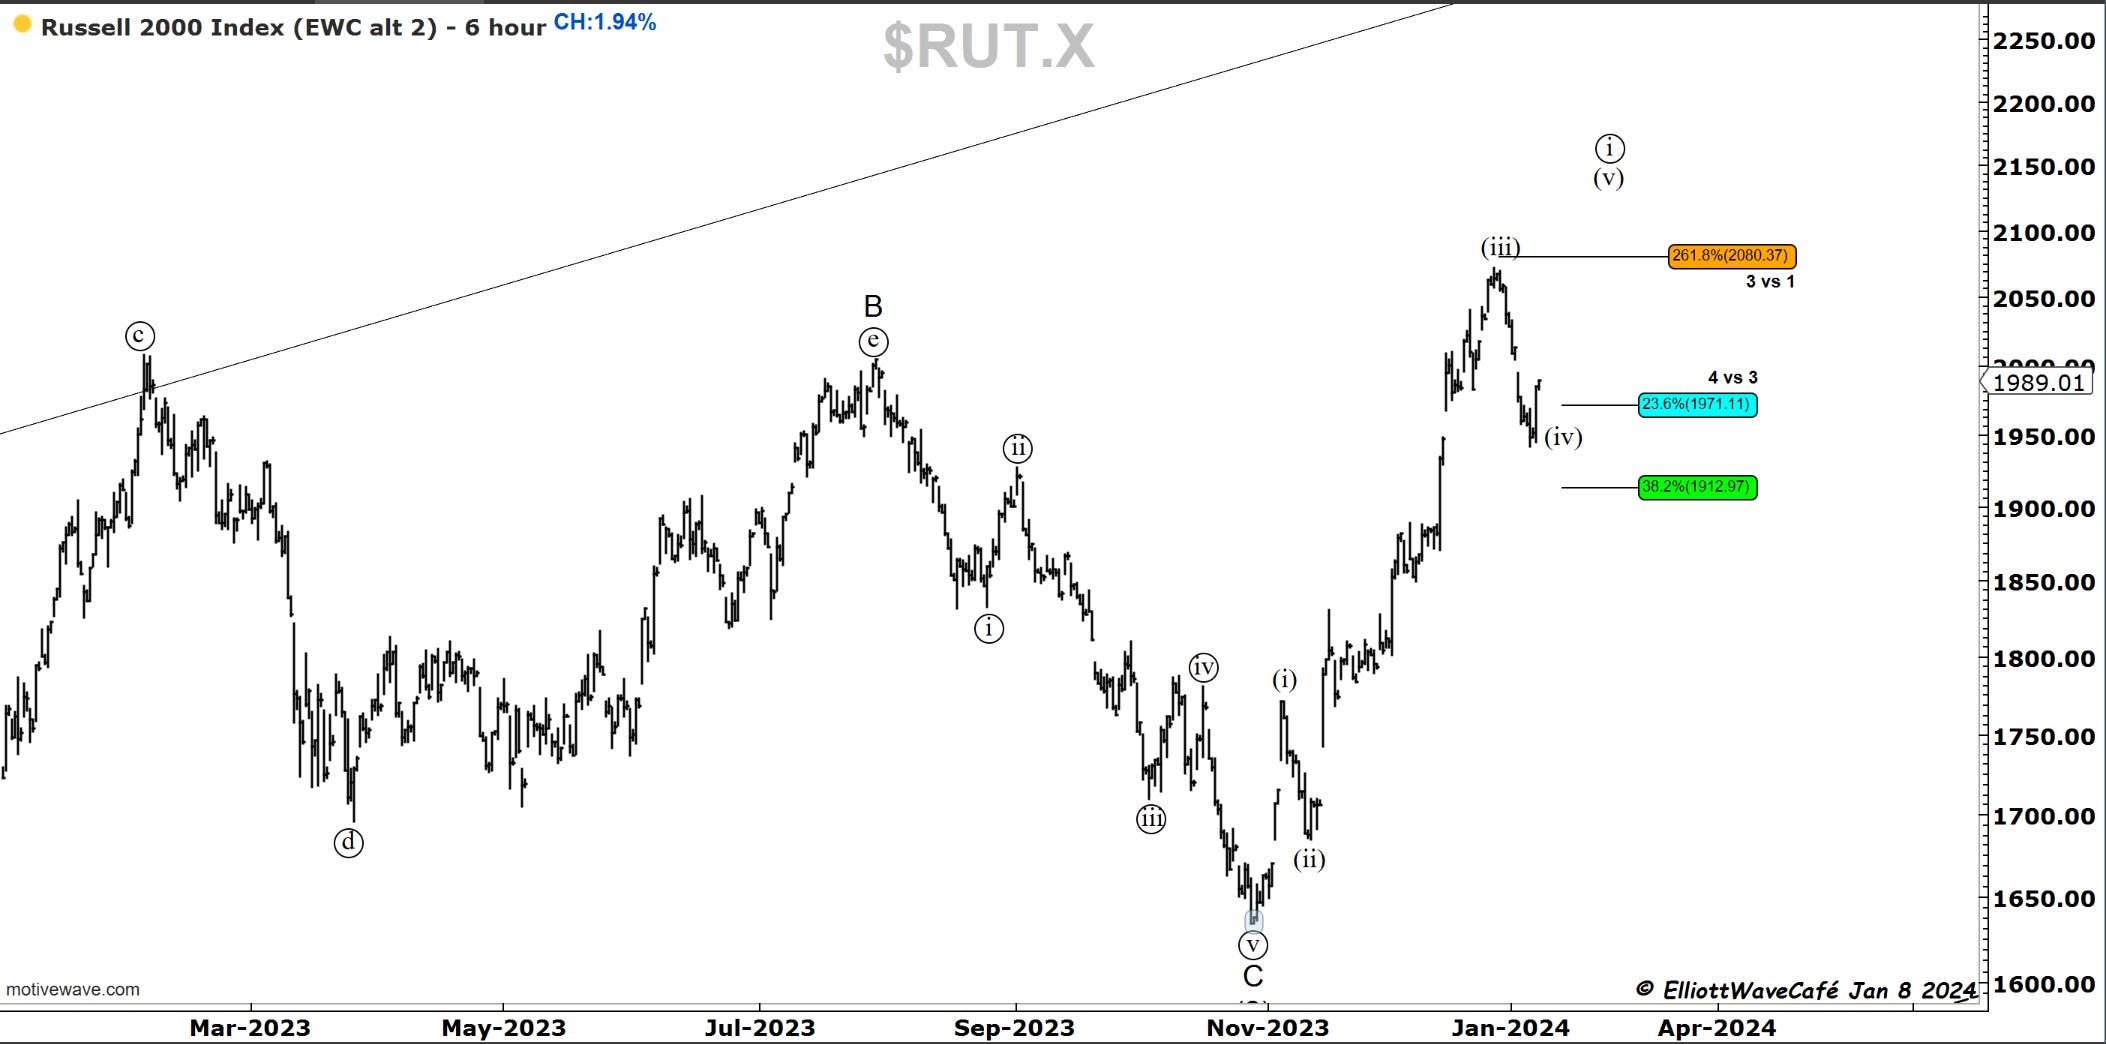
Both counts in Russell can stand on their own, and both are suggesting corrective prices to continue. The second count would make one more high in wave (v) first.
If that’s the case, it’s likely all indices would make another high, suggesting this correction across the board was nothing but a 4th wave still.
There are different trading plans that can be executed based on the preferred scenario. The beauty of EW is that it gives you defensive levels to protect trades, in case the road map presented does not work out.

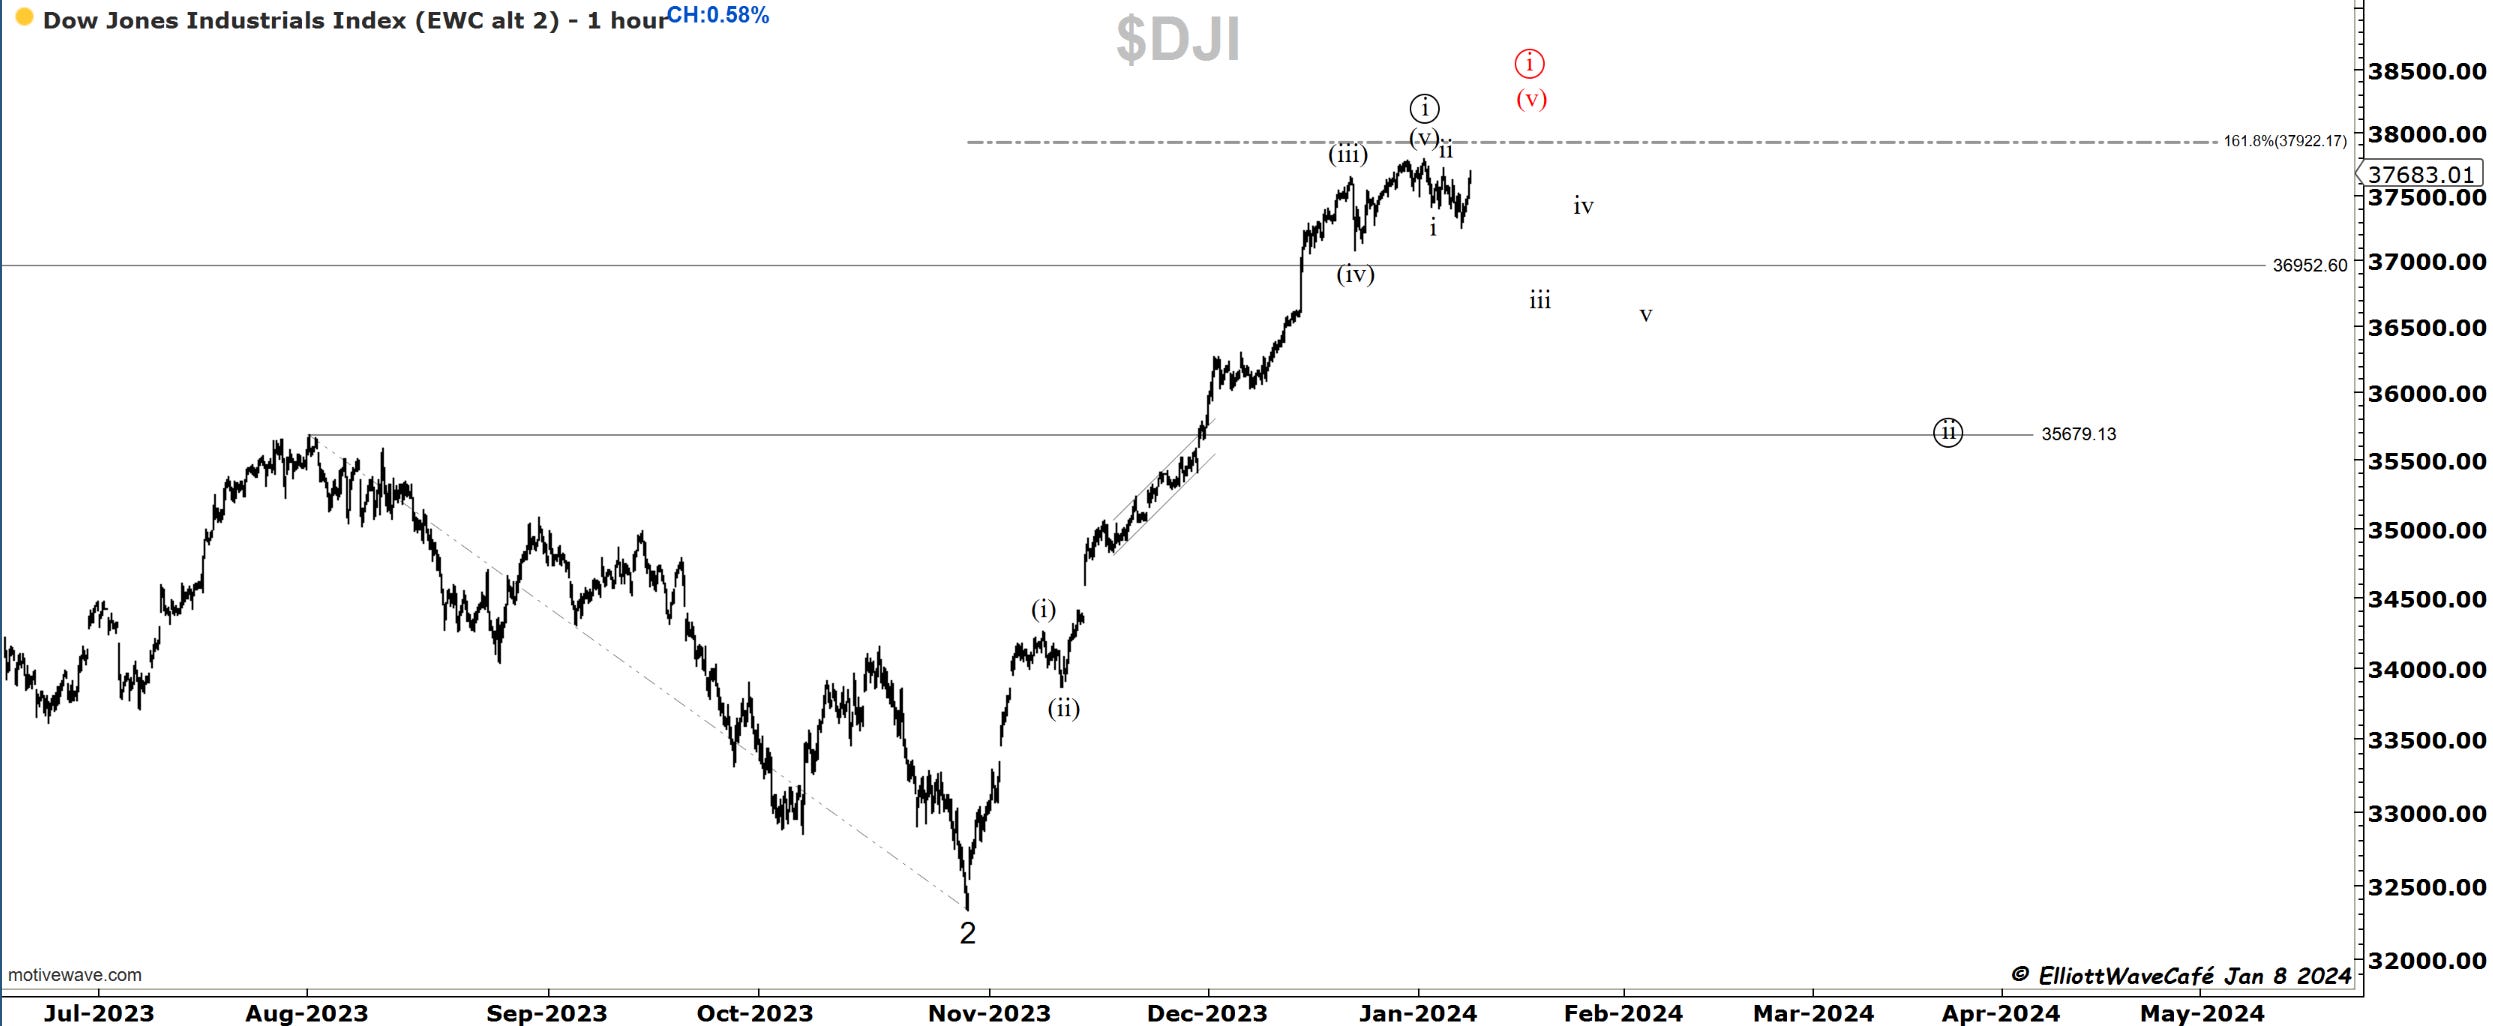
Dow30
One more push towards the highs is throwing some cold water on the continuation of the impulse lower. The structure has not severely changed, but the count will be temporarily invalidated if we make another high. As mentioned above, that would suggest that the current move was nothing else but a wave (iv) still forming with wave (v) yet to come. Overall, the whole advance from early November is standing without a proper correction, which is bound to take place as January and February unfold.
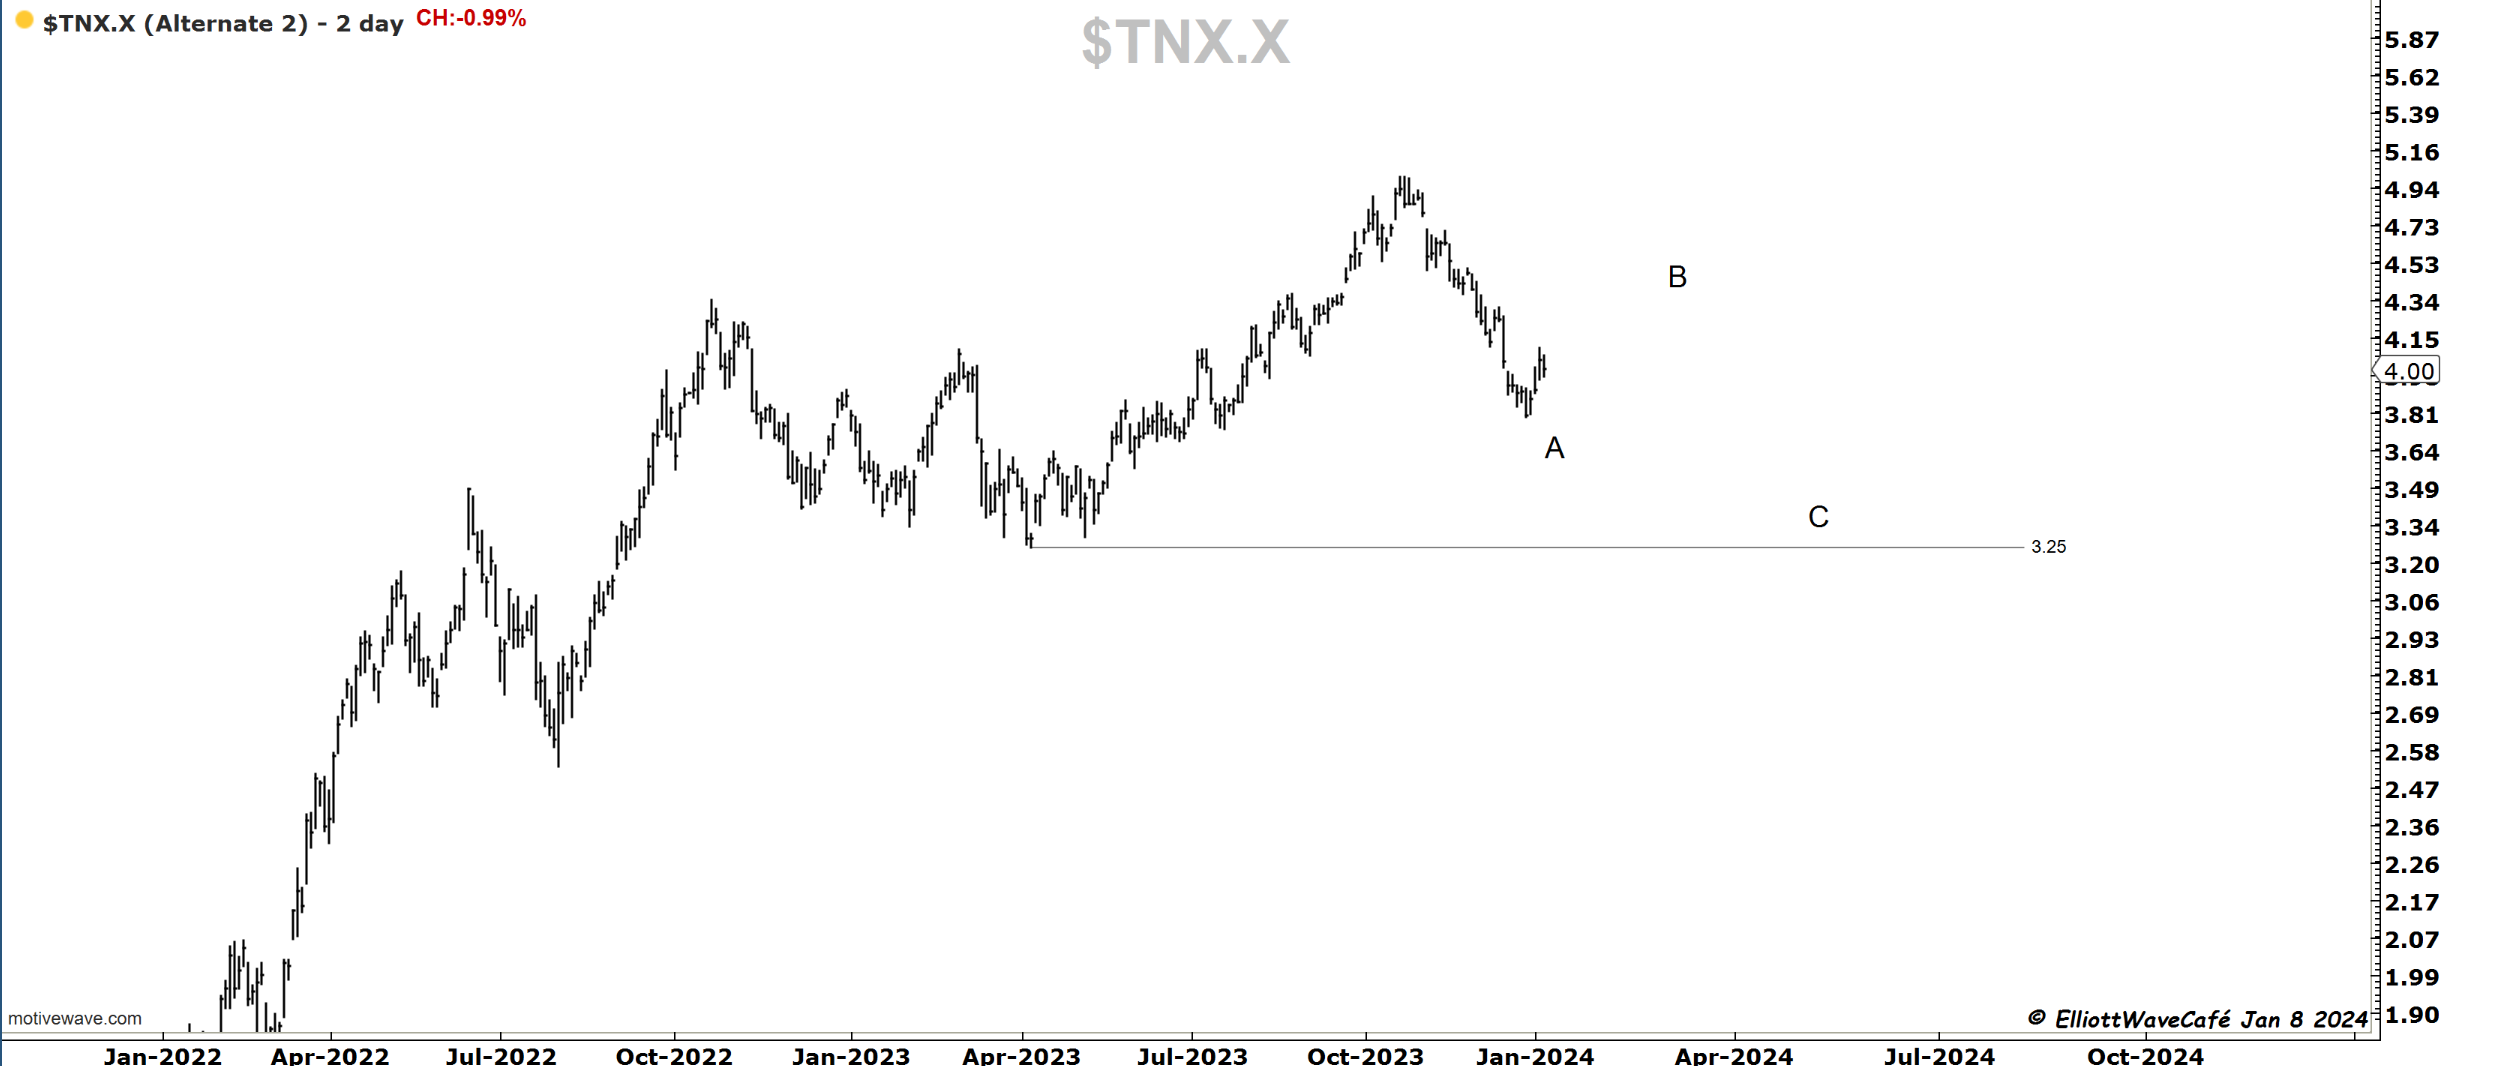
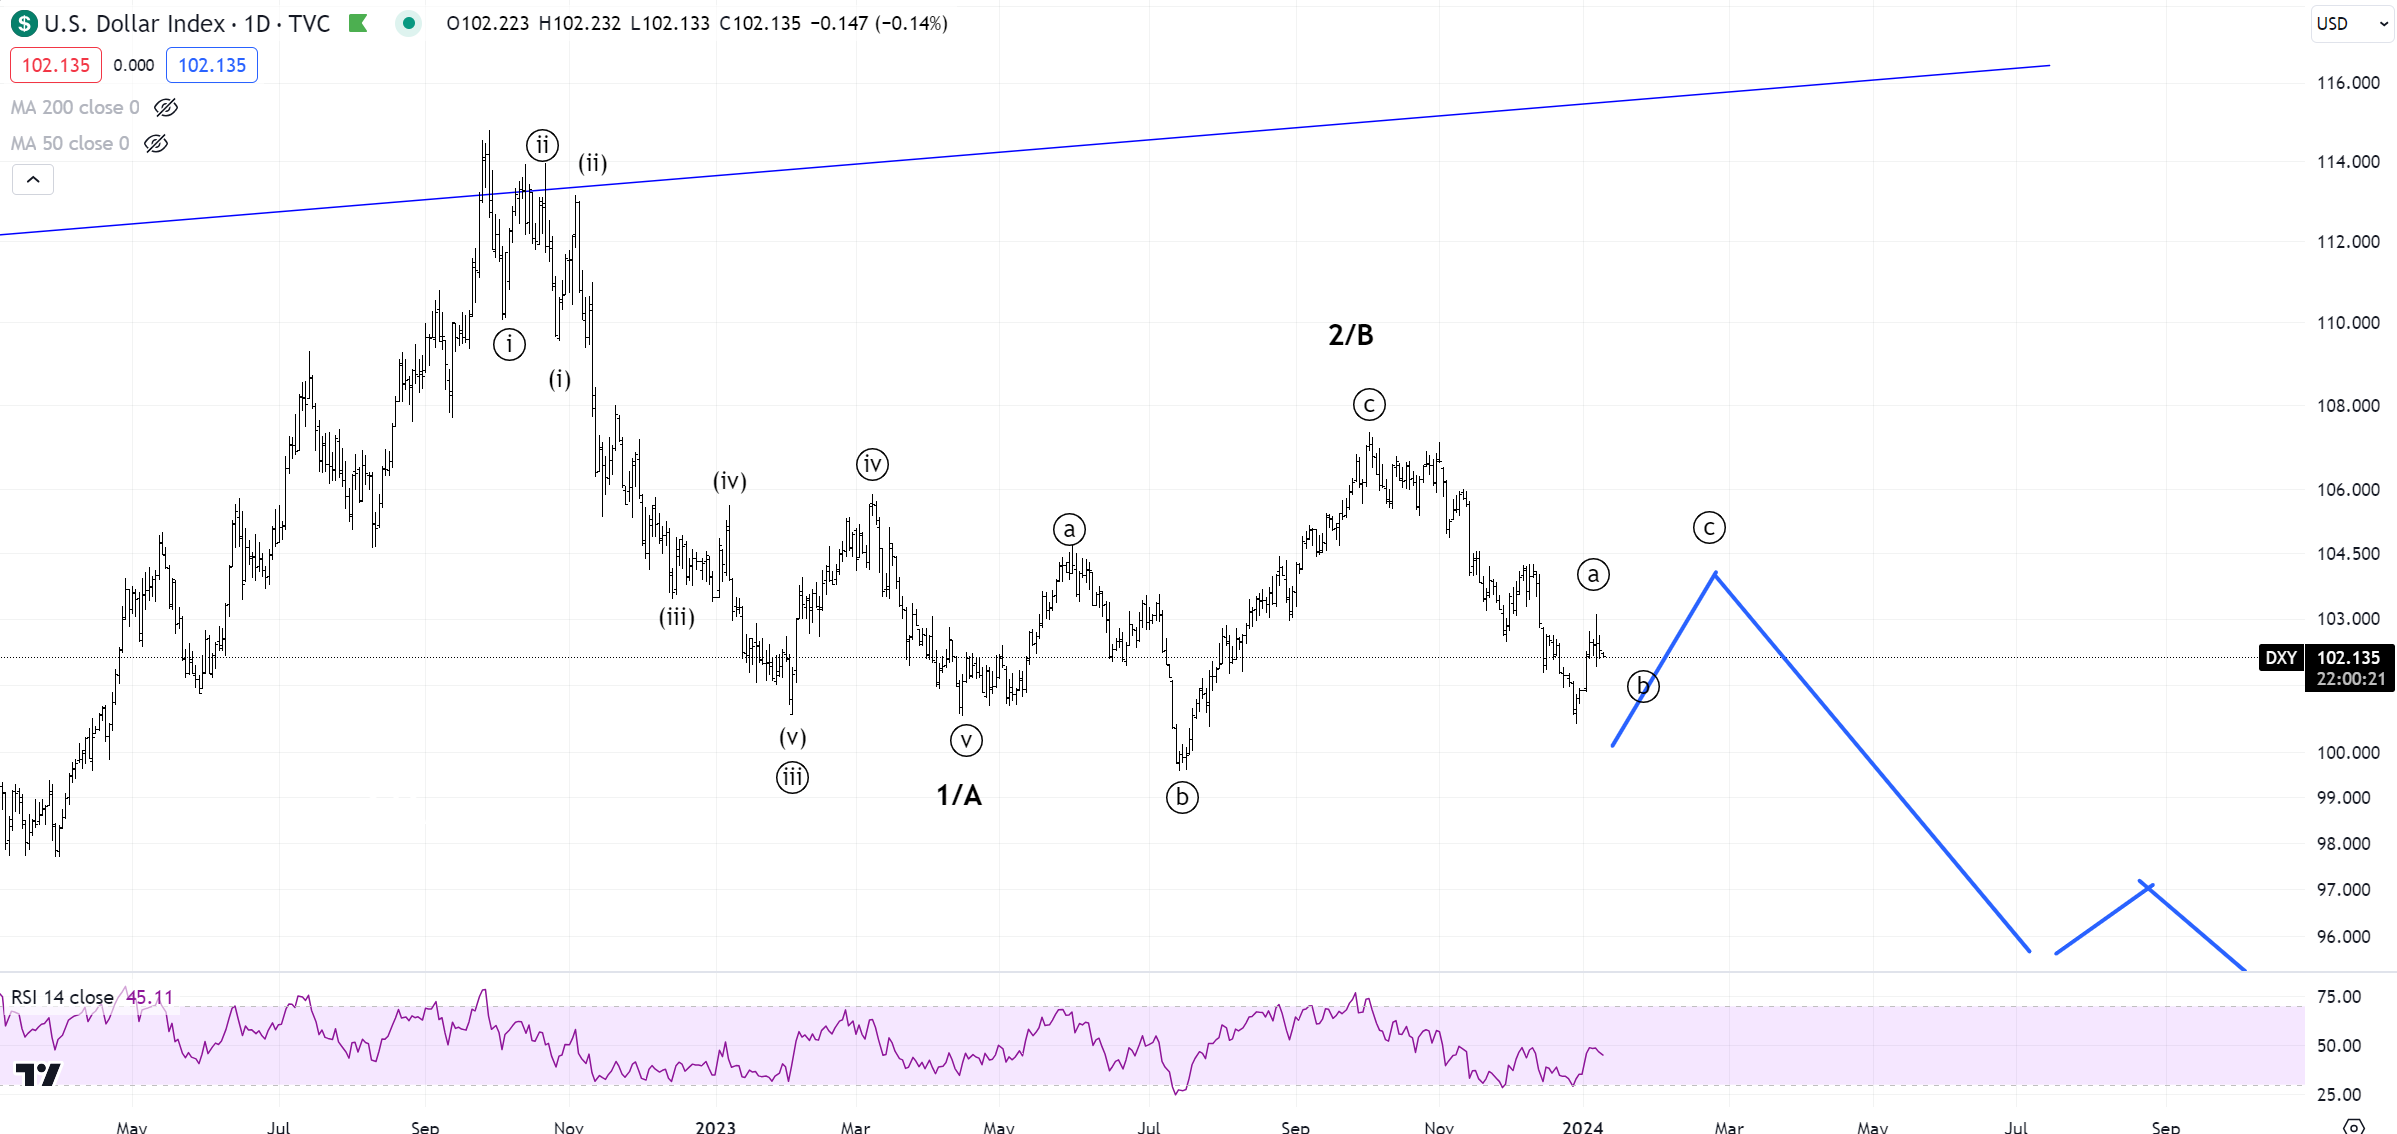
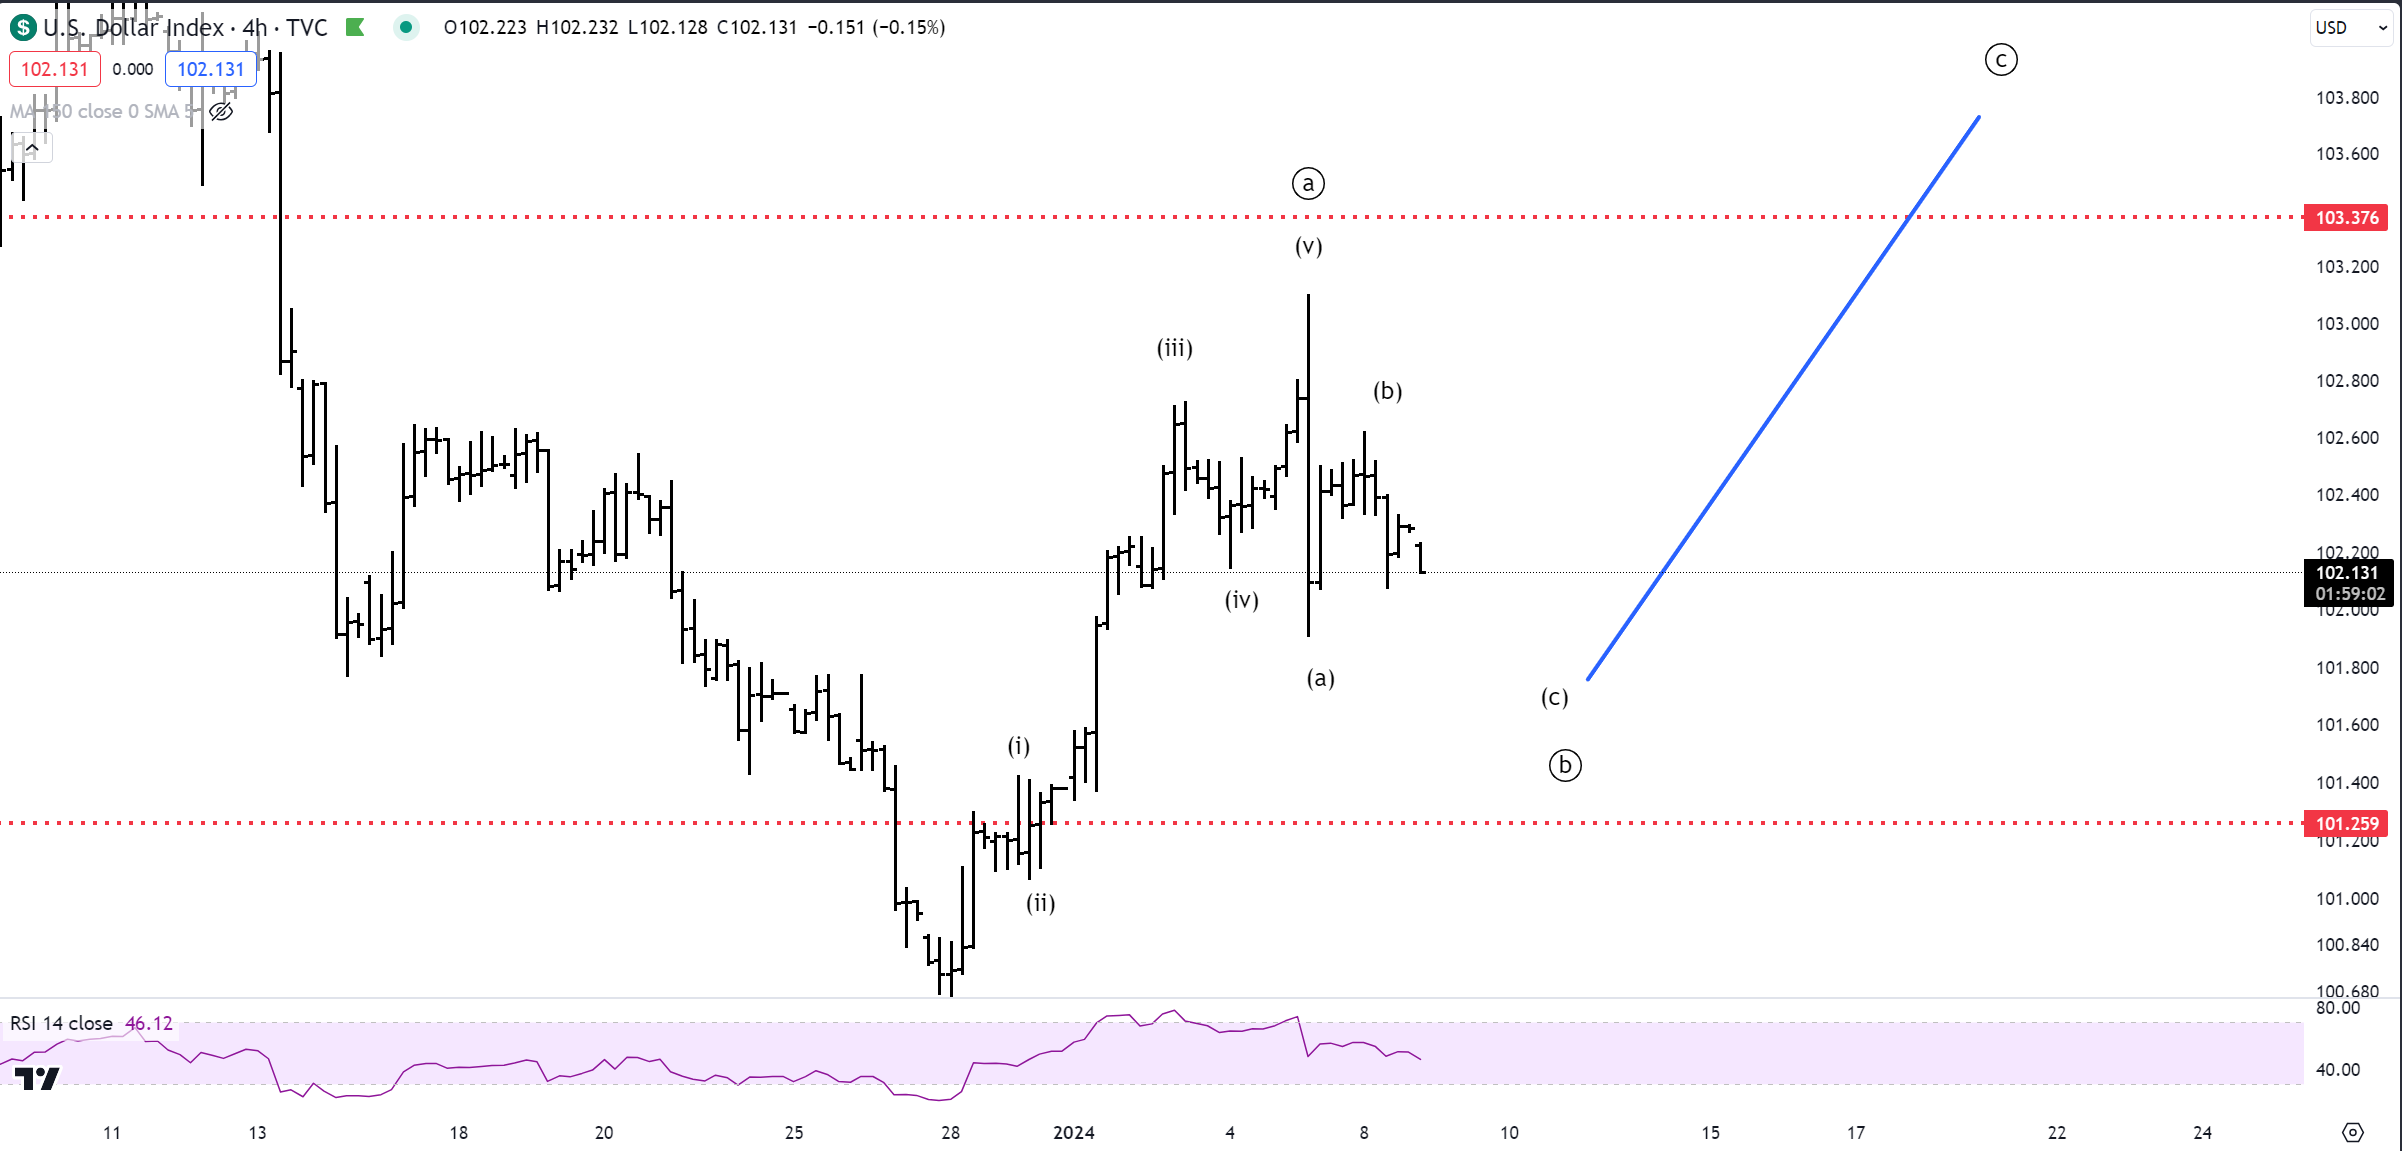
US Dollar and Yields
Both dollar and yields were a touch weaker today but nothing trend or count changing. My work suggests a continuous move higher in yields towards a likely B wave with a dollar that’s also poised for strength as January unfolds. You can see the suggested counts below. It would line up with equity weakness while also looking at seasonality and cycles.
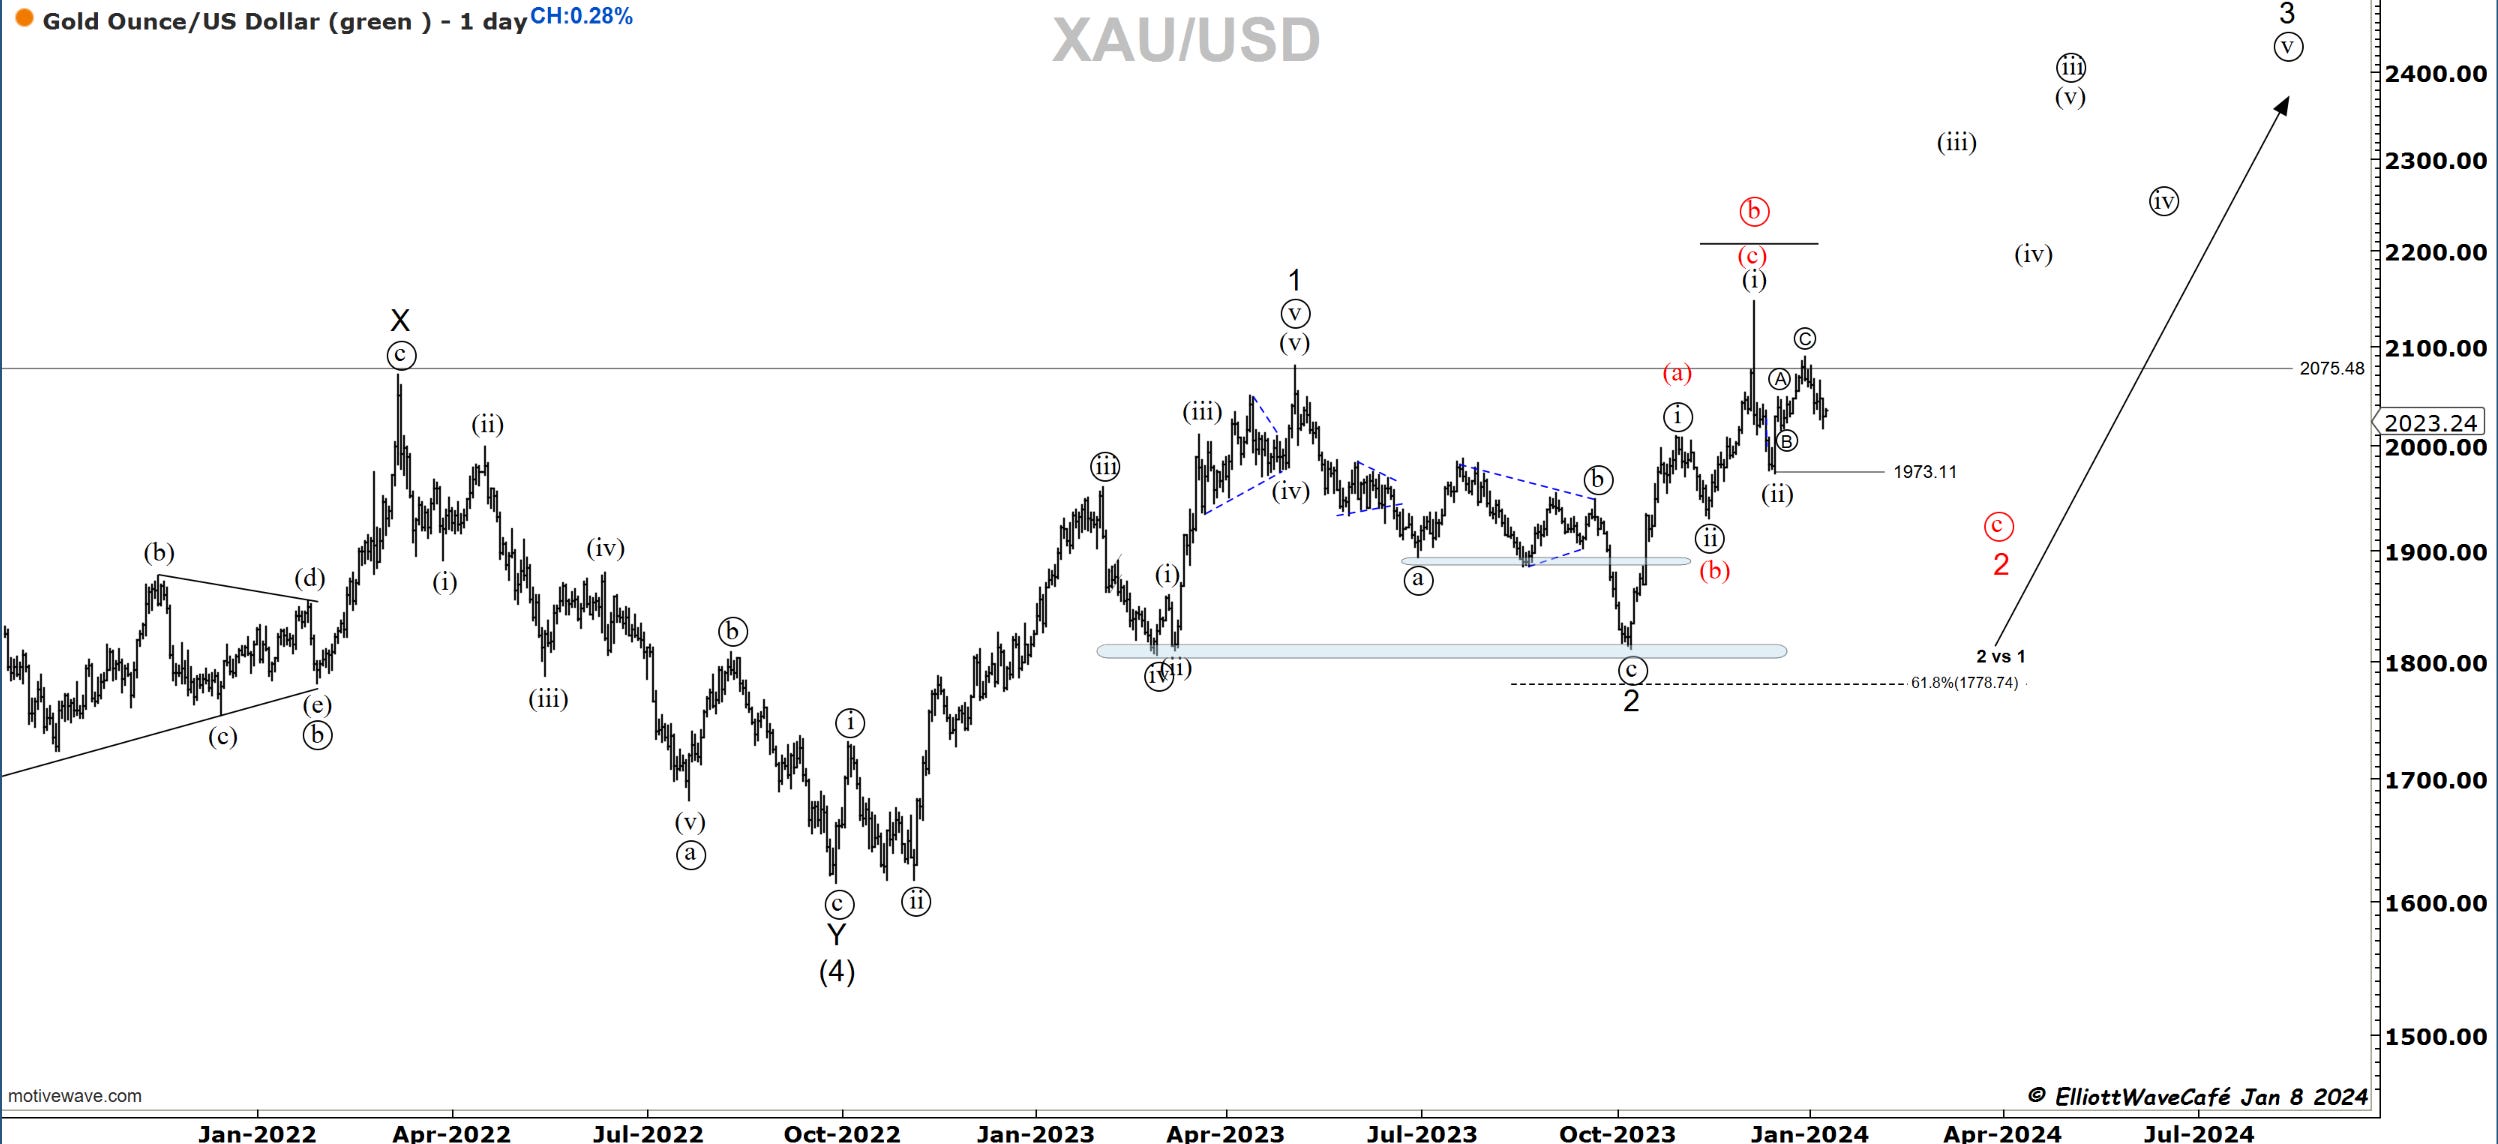
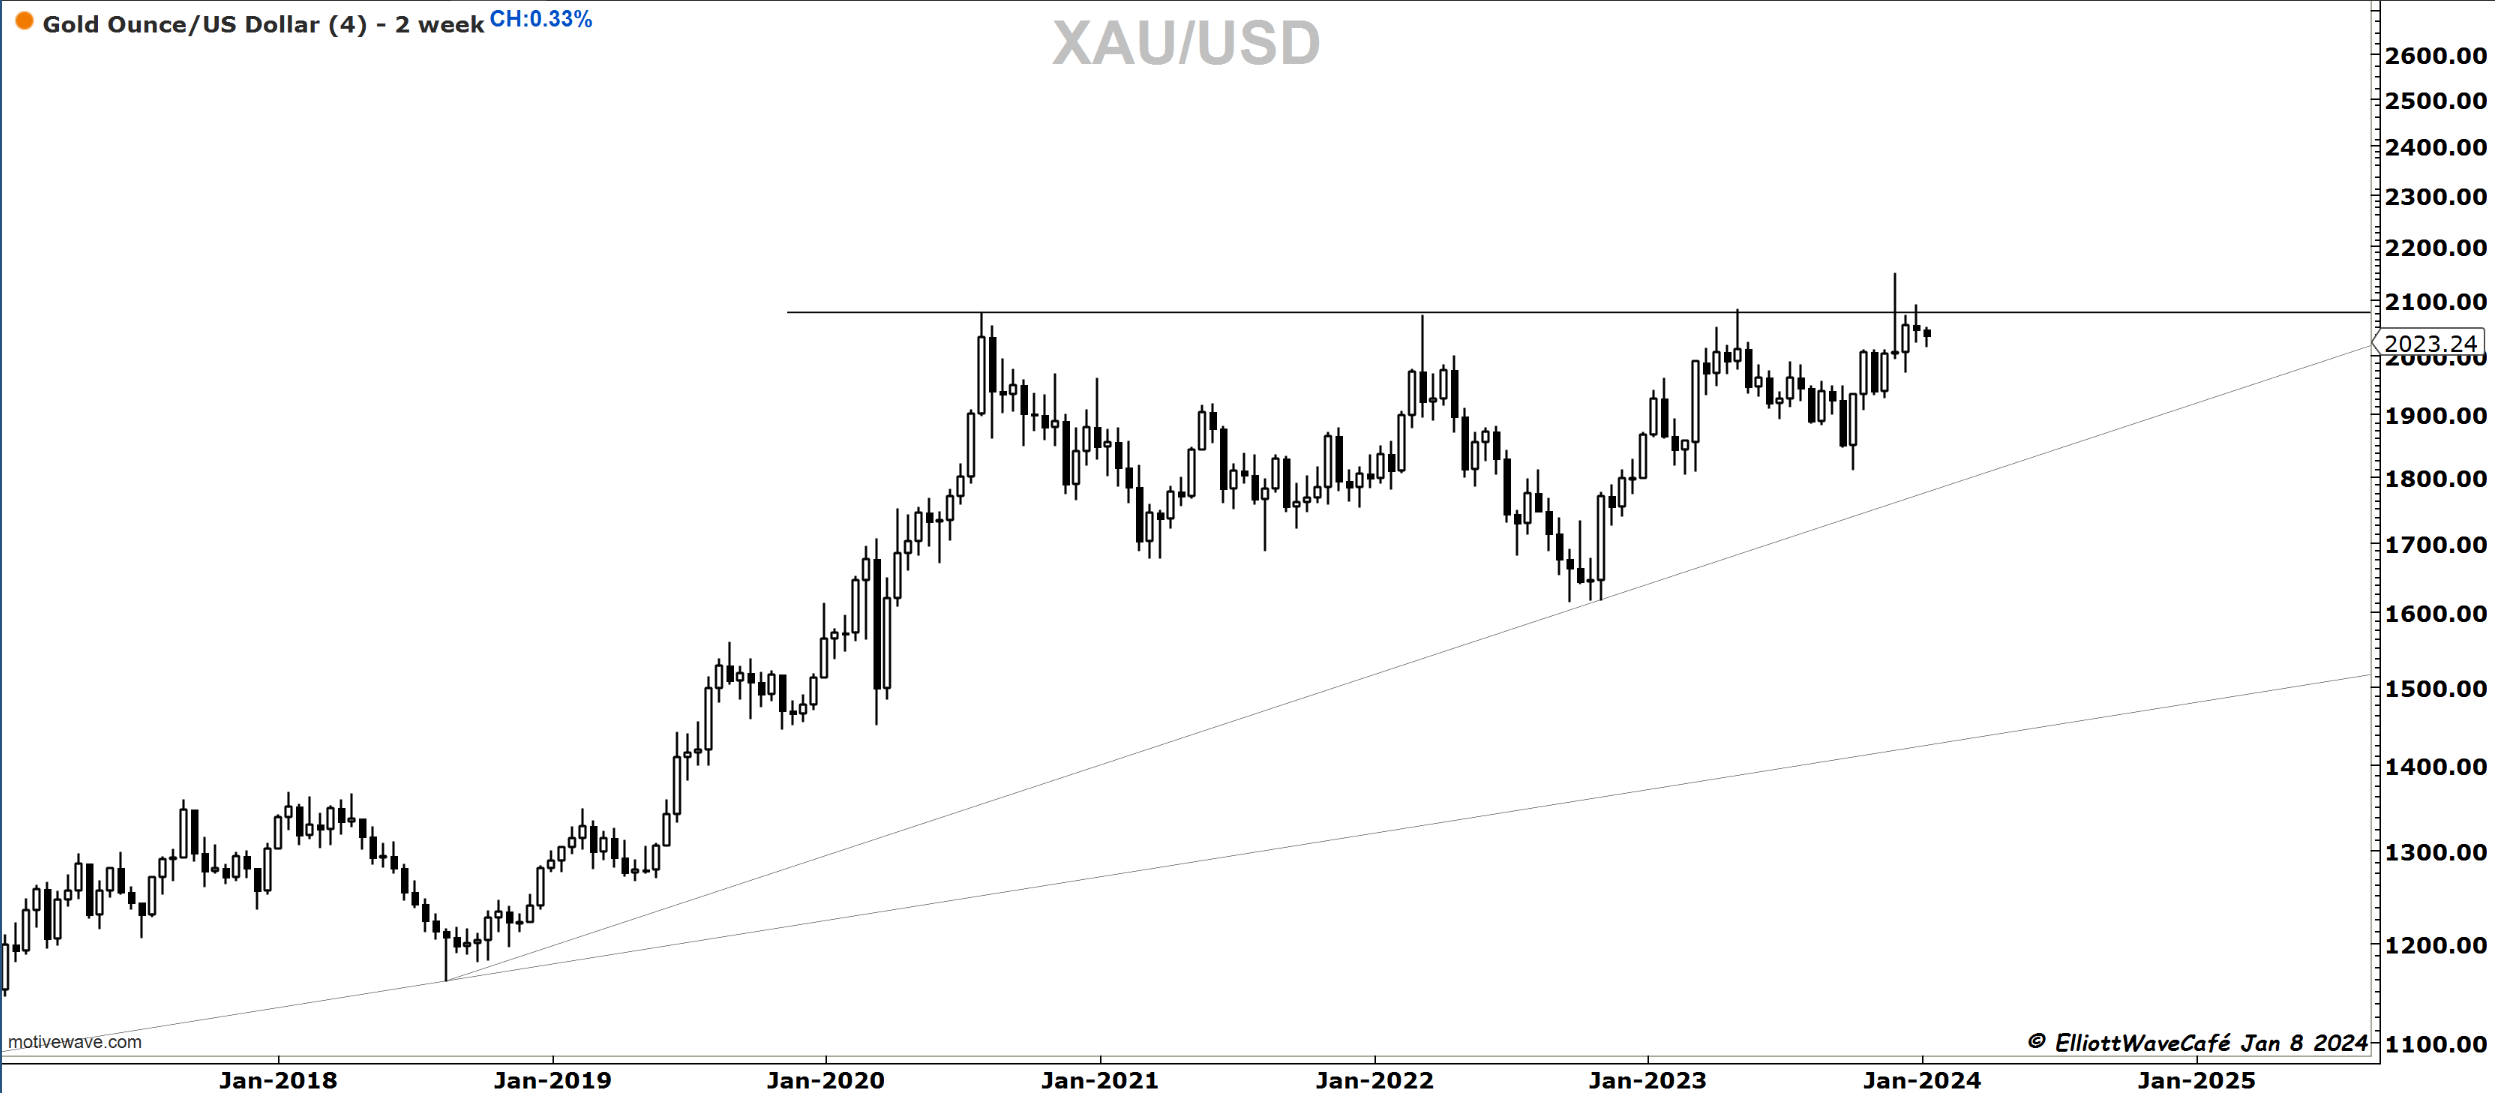
Gold
Gold continues to tease just under the ATH. There are multiple macro views that one could take by looking at money supply, liquidity, inverted curve, real yields, dollar, etc. I am sure everyone can make a compelling case of why gold should do one thing vs the other. I am also sure that once a move is made, all those reasons will be offered as proof of why something happened.
The reality is that Gold has not followed upwards after the failed move, and under a possible 1,2 1,2, it should have broken already. It has not yet succumbed lower either in a ((c )) wave of 2. There is really not a whole lot that can be done here for a swing trader looking a week or 2 out. It’s one of those markets best left being observed until more levels get taken out.
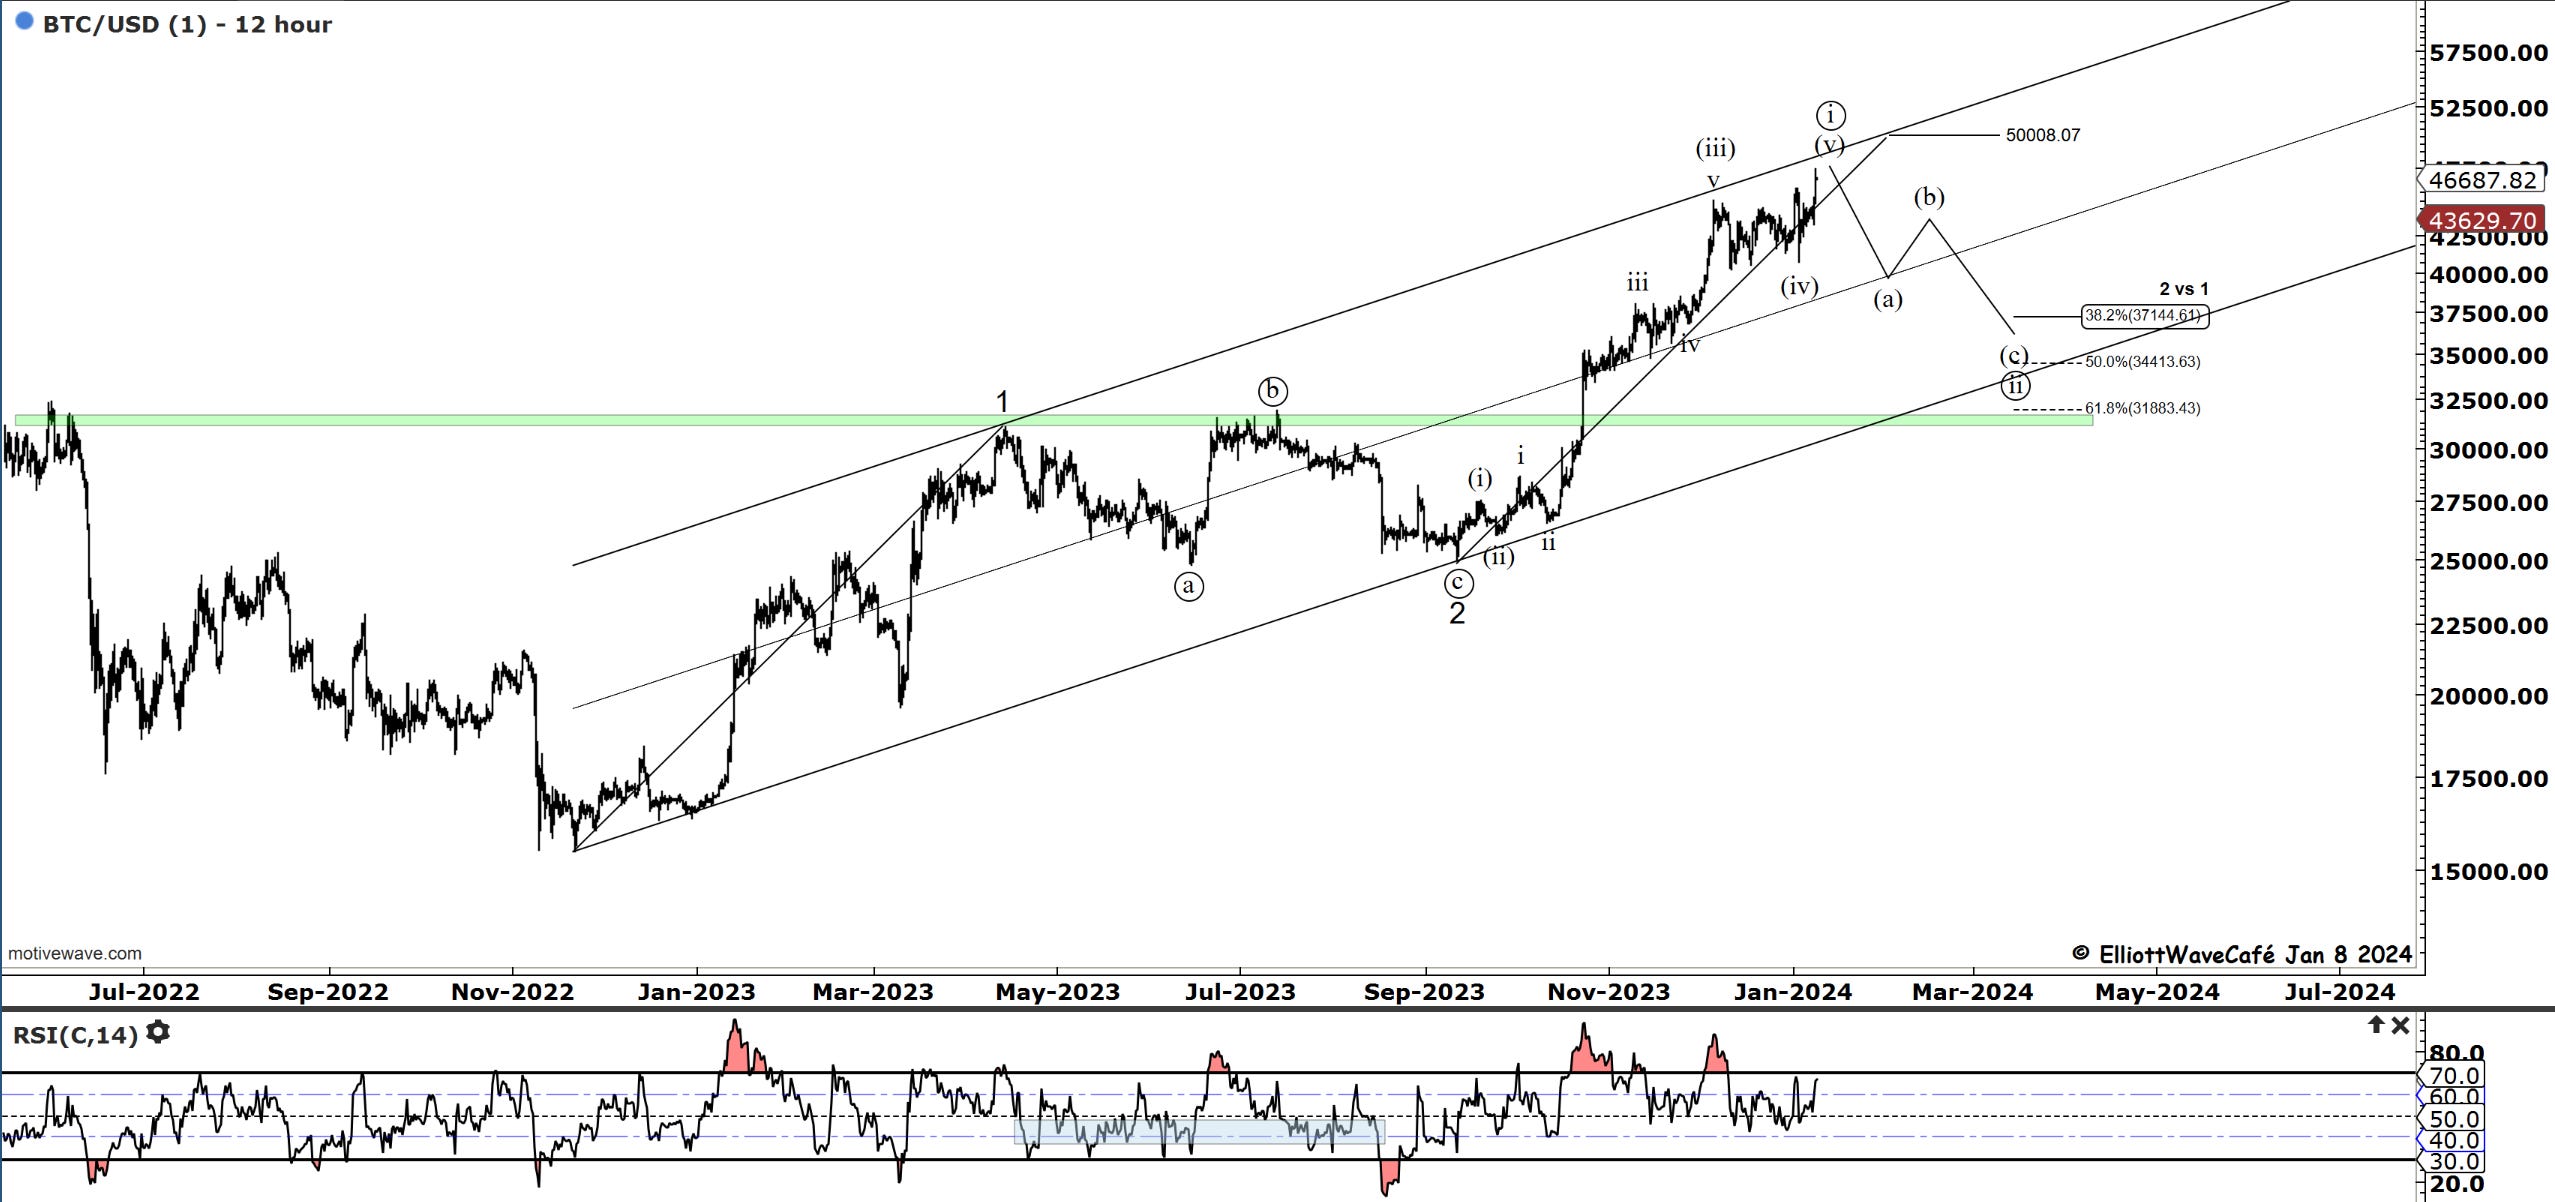
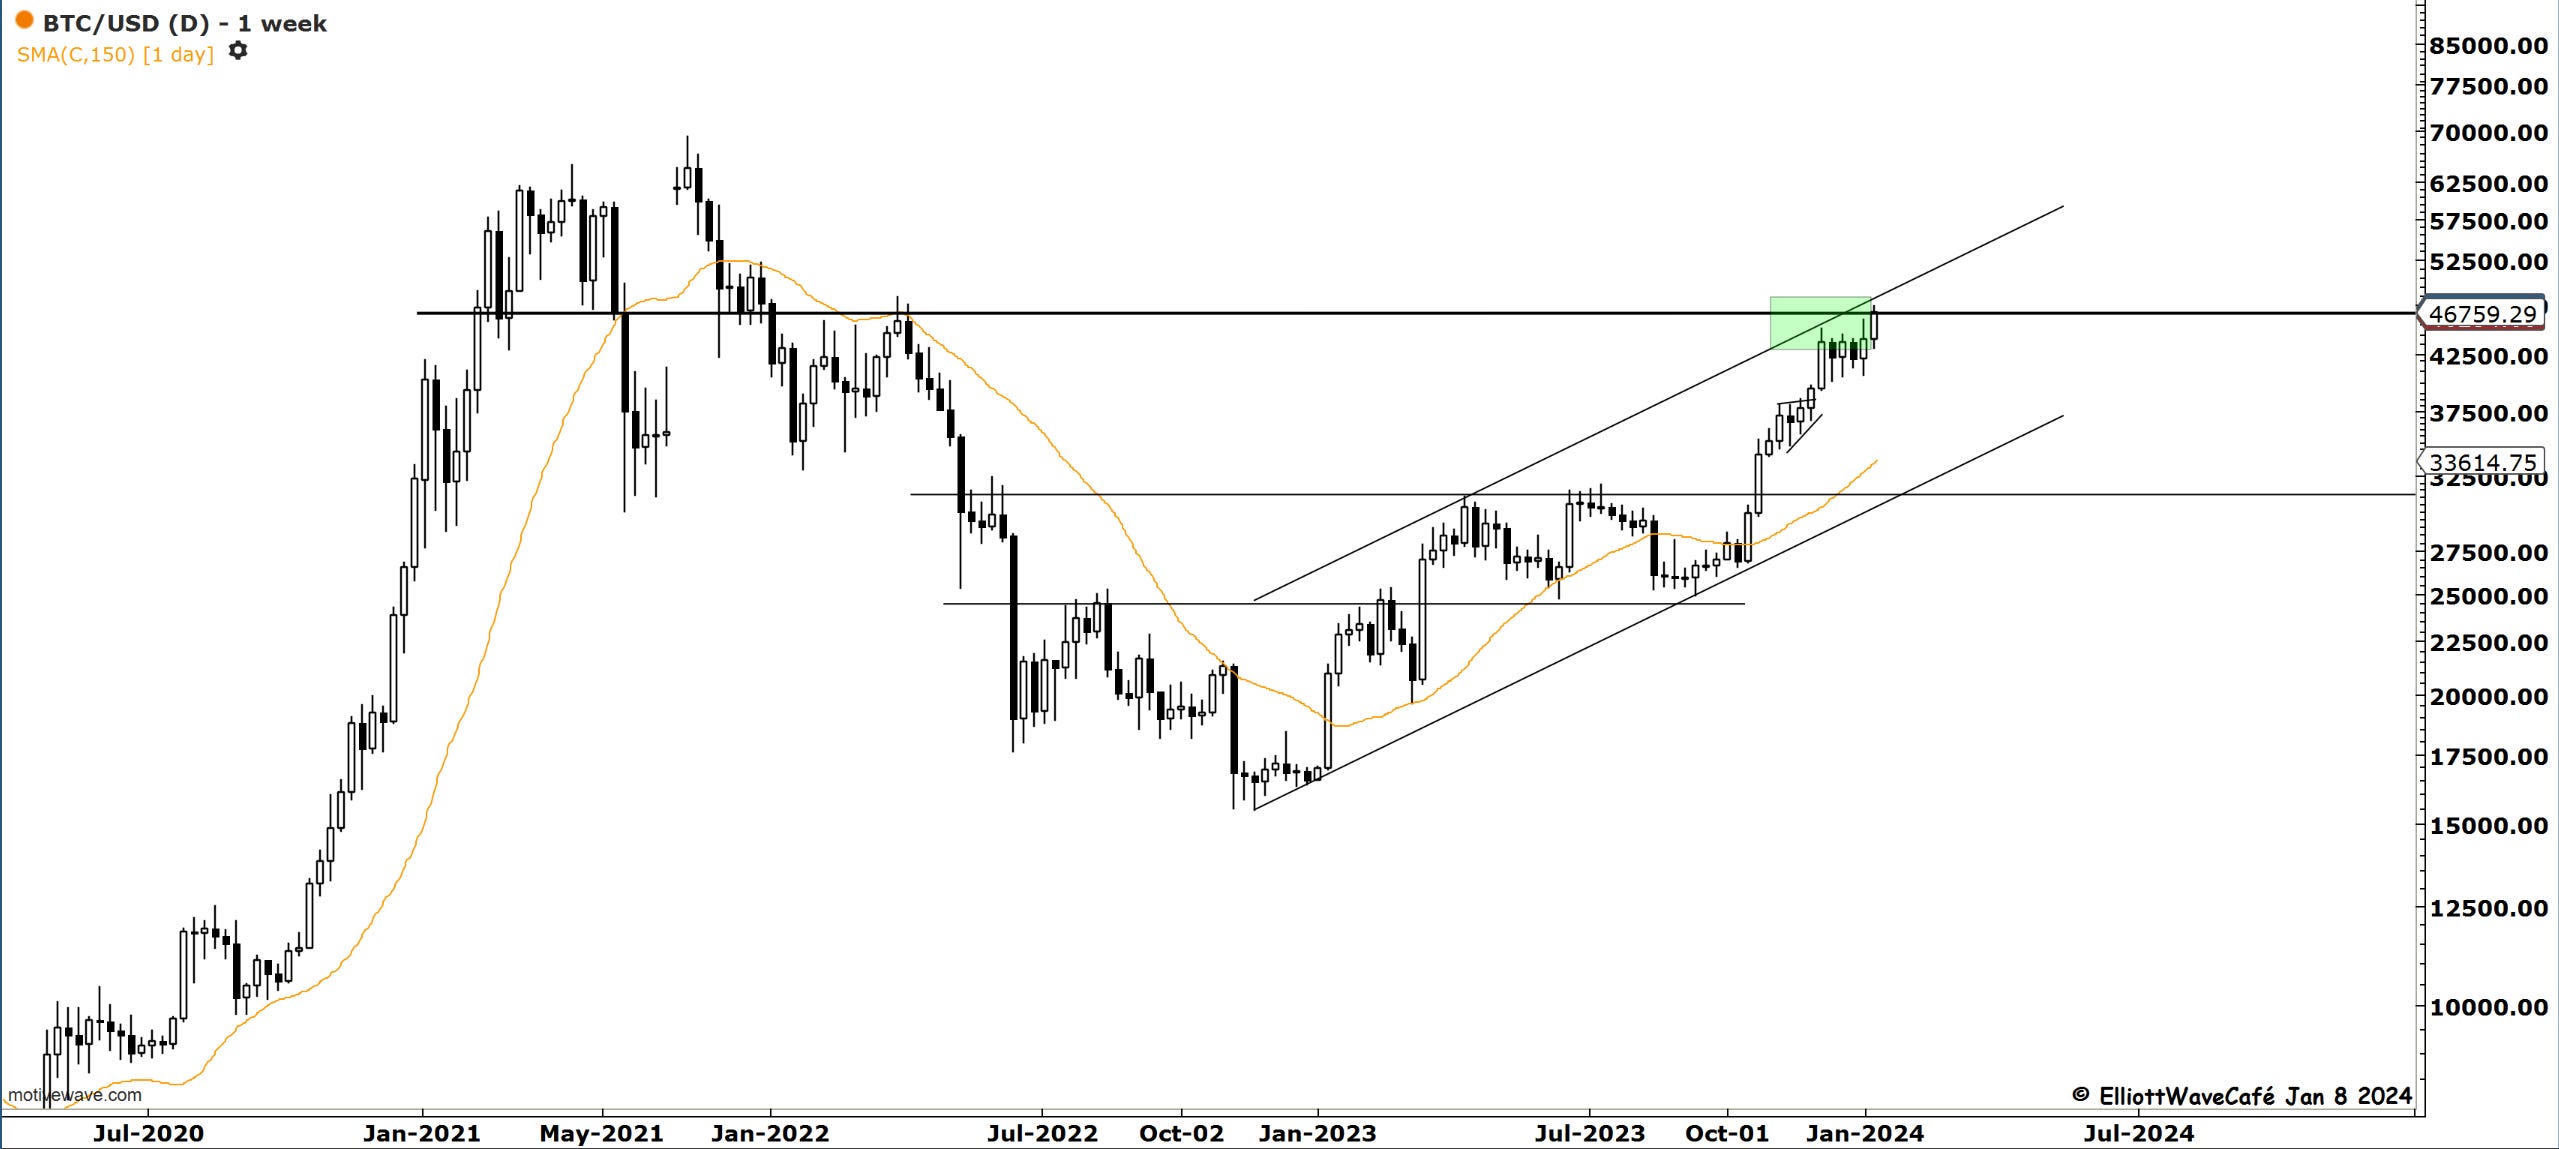
Bitcoin
Bitcoin sneaked higher today, managing to overtake 45k. We’re continuing to hug the higher part of the trending channel at a pretty slow rate. The ETF news is fairly positive but has yet to be officially approved/announced. It does seem that the market is gearing up for it. Getting an exploding move higher from here seems a bit unlikely in my view and maybe a bit too consensus. I will continue to favor a corrective period that balances out the advance from Sept ‘23.
On a shorter-term basis, one can continue to milk the long side, while using 43,200 as defense.
The weekly charts look pretty strong, especially after this 50k hurdle gets removed.
“Double shot” Daily member video coming up next,
If you’re new to Elliott Wave or need to refresh, there is a 7-hour video course with downloadable slides under The Coarse tab on the website.
Have a great day wherever you are! - trade well, and don’t forget to subscribe and drop a like if this letter helps you in any way.
Cris
email: ewcafe@pm.me