
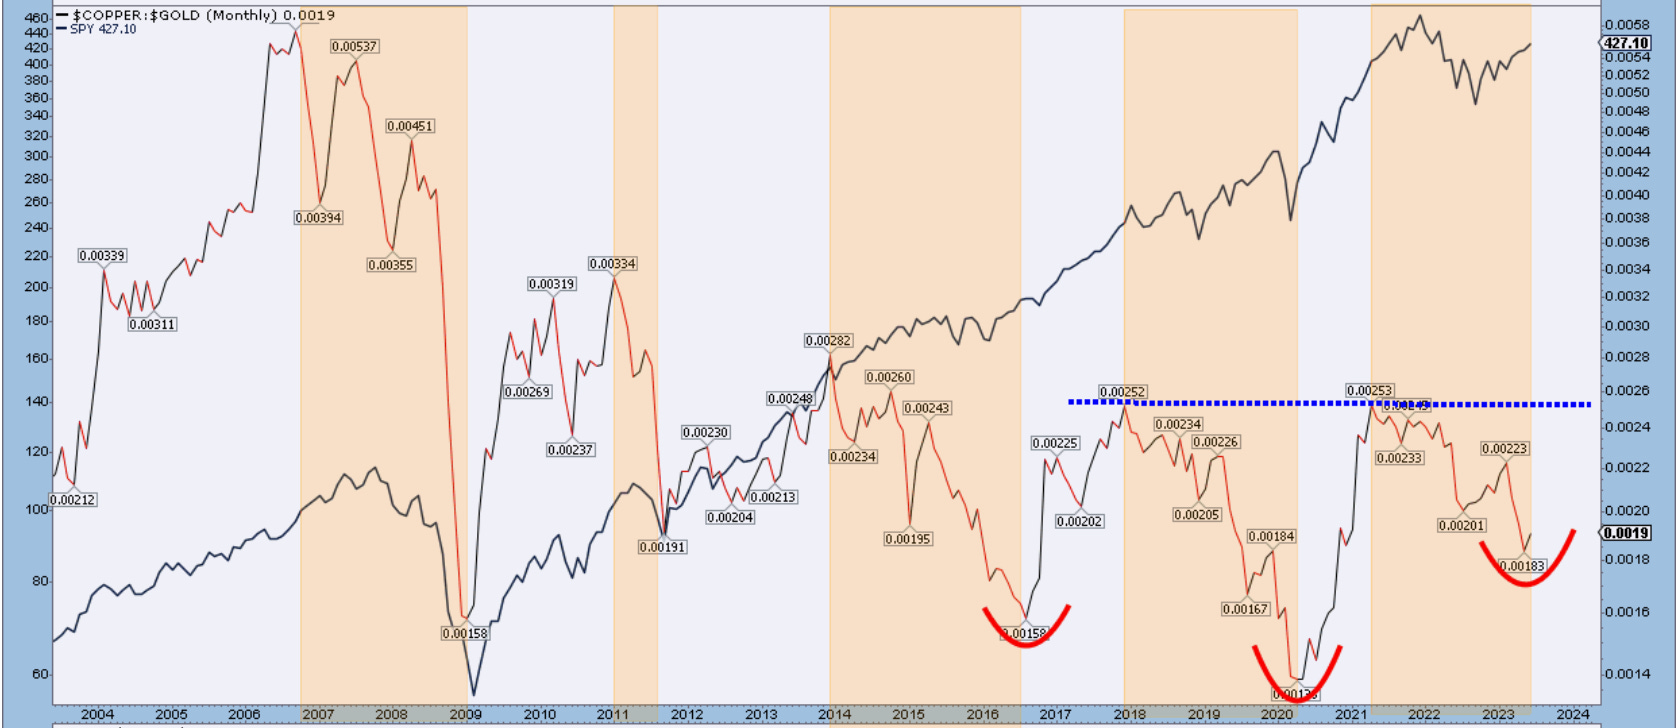
A ratio hidden from retail traders

Very few traders are following this ratio. It’s common amongst macro researchers but not that much in the retail crowd.
The black line is the SP500.
The red/black line is the ratio between copper and gold. When the line goes up, copper outperforms gold; when the line goes down, gold outperforms copper.
The reason we glimpse at it is because it provides us with a quick look at the health of the markets and global economic health. When the world buys copper and sells gold, it has more confidence in the future. It signals stronger economic growth and industrial demand. When gold outperforms is a sign of fear and uncertainty—a hunt for safety instead of risk.
If you notice the orange areas when copper underperformed gold, the SP500 had trouble advancing. During the white zones, when the ratio climbed in favor of copper, the stock market did pretty well.
From a pure Elliott Wave perspective, I notice a 3-wave decline in the ratio since early 2021, when markets started to struggle or were in the process of topping. We are now creating an inverse Head and Shoulder, and the ratio seems to try to turn higher. The price of the Sp500 is also climbing. These are very early signs that we could be finally coming out of a 2 year period of slow economic growth and stock prices declining. If we manage to get back above the blue neckline, we could be in for a major rally.
Keep a close eye on this one.
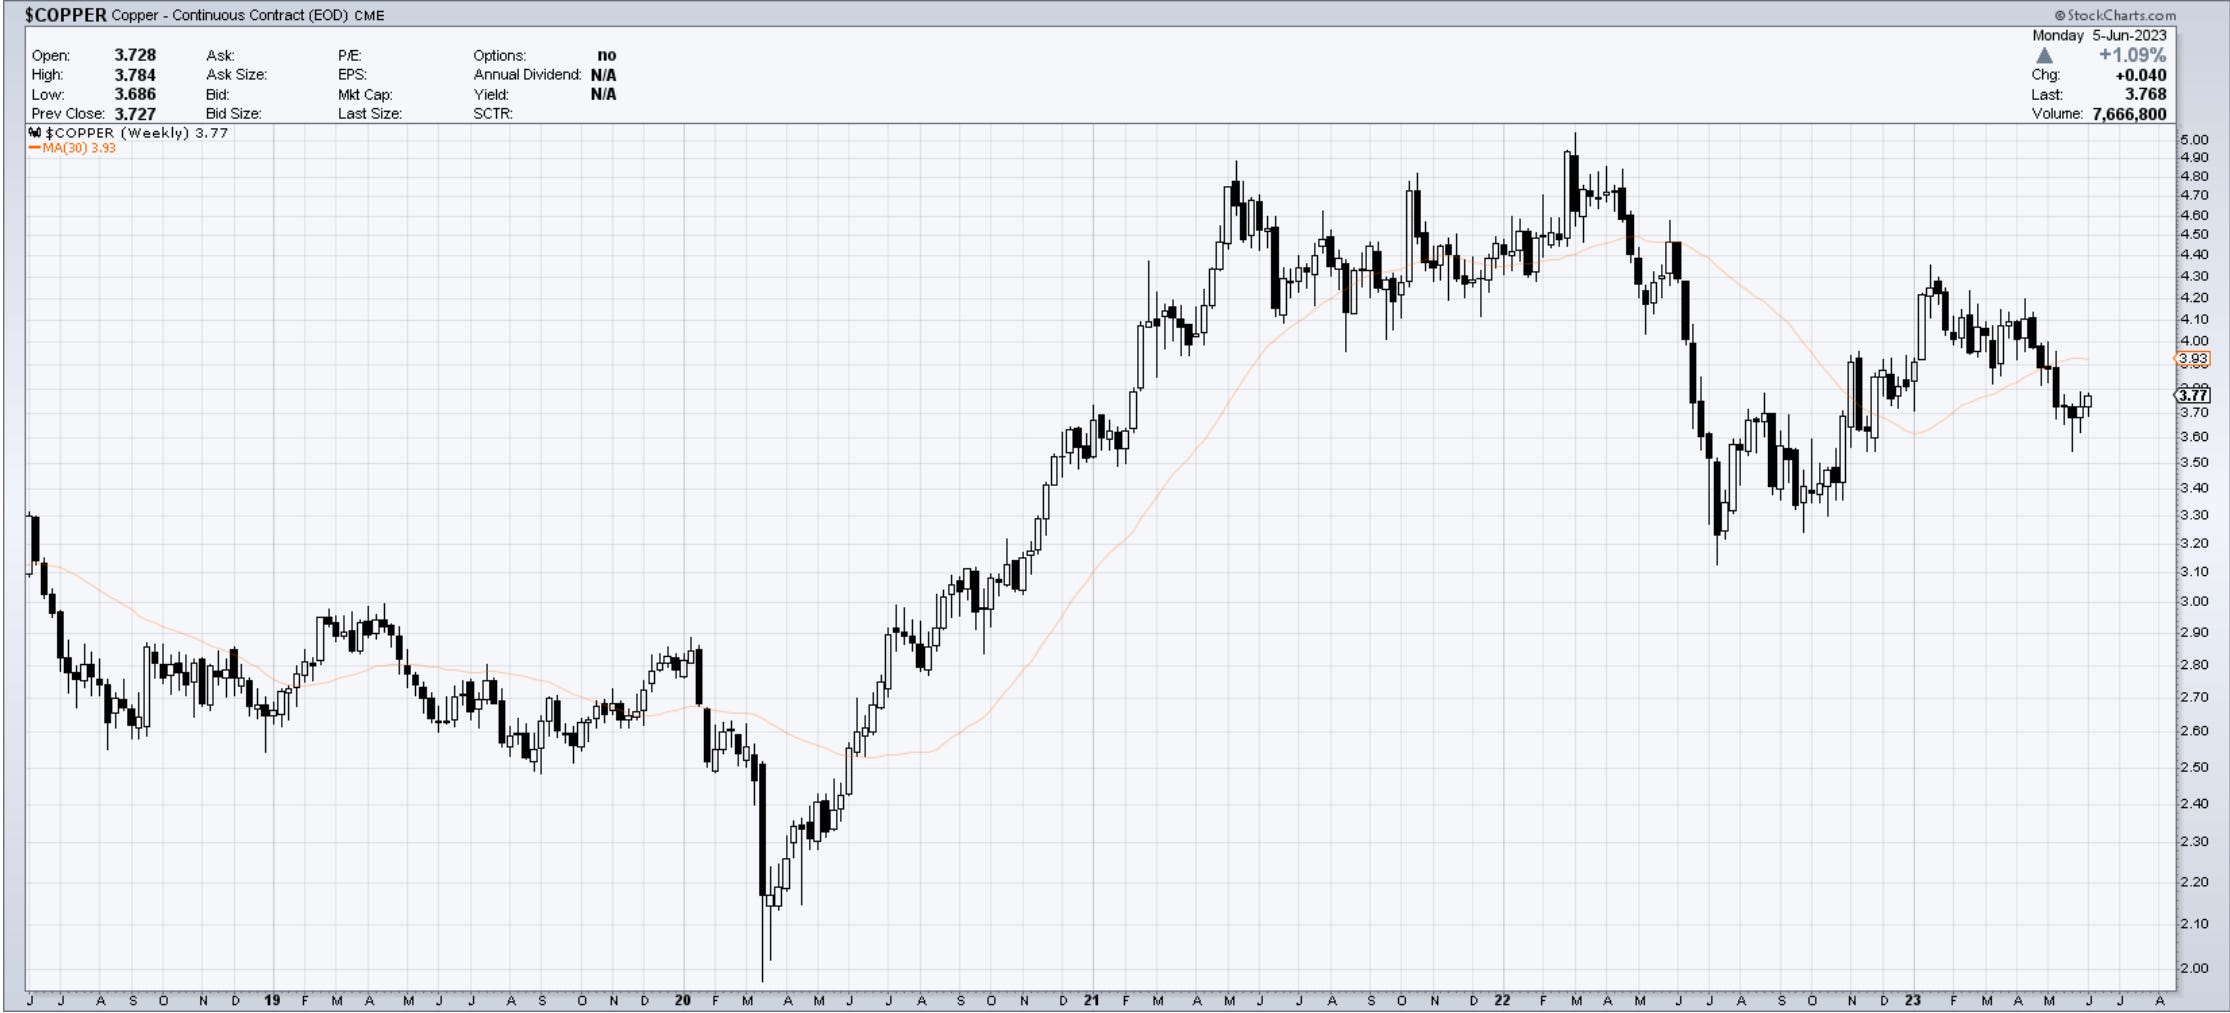
Copper futures looking like they’ve done their 3 wave setback.
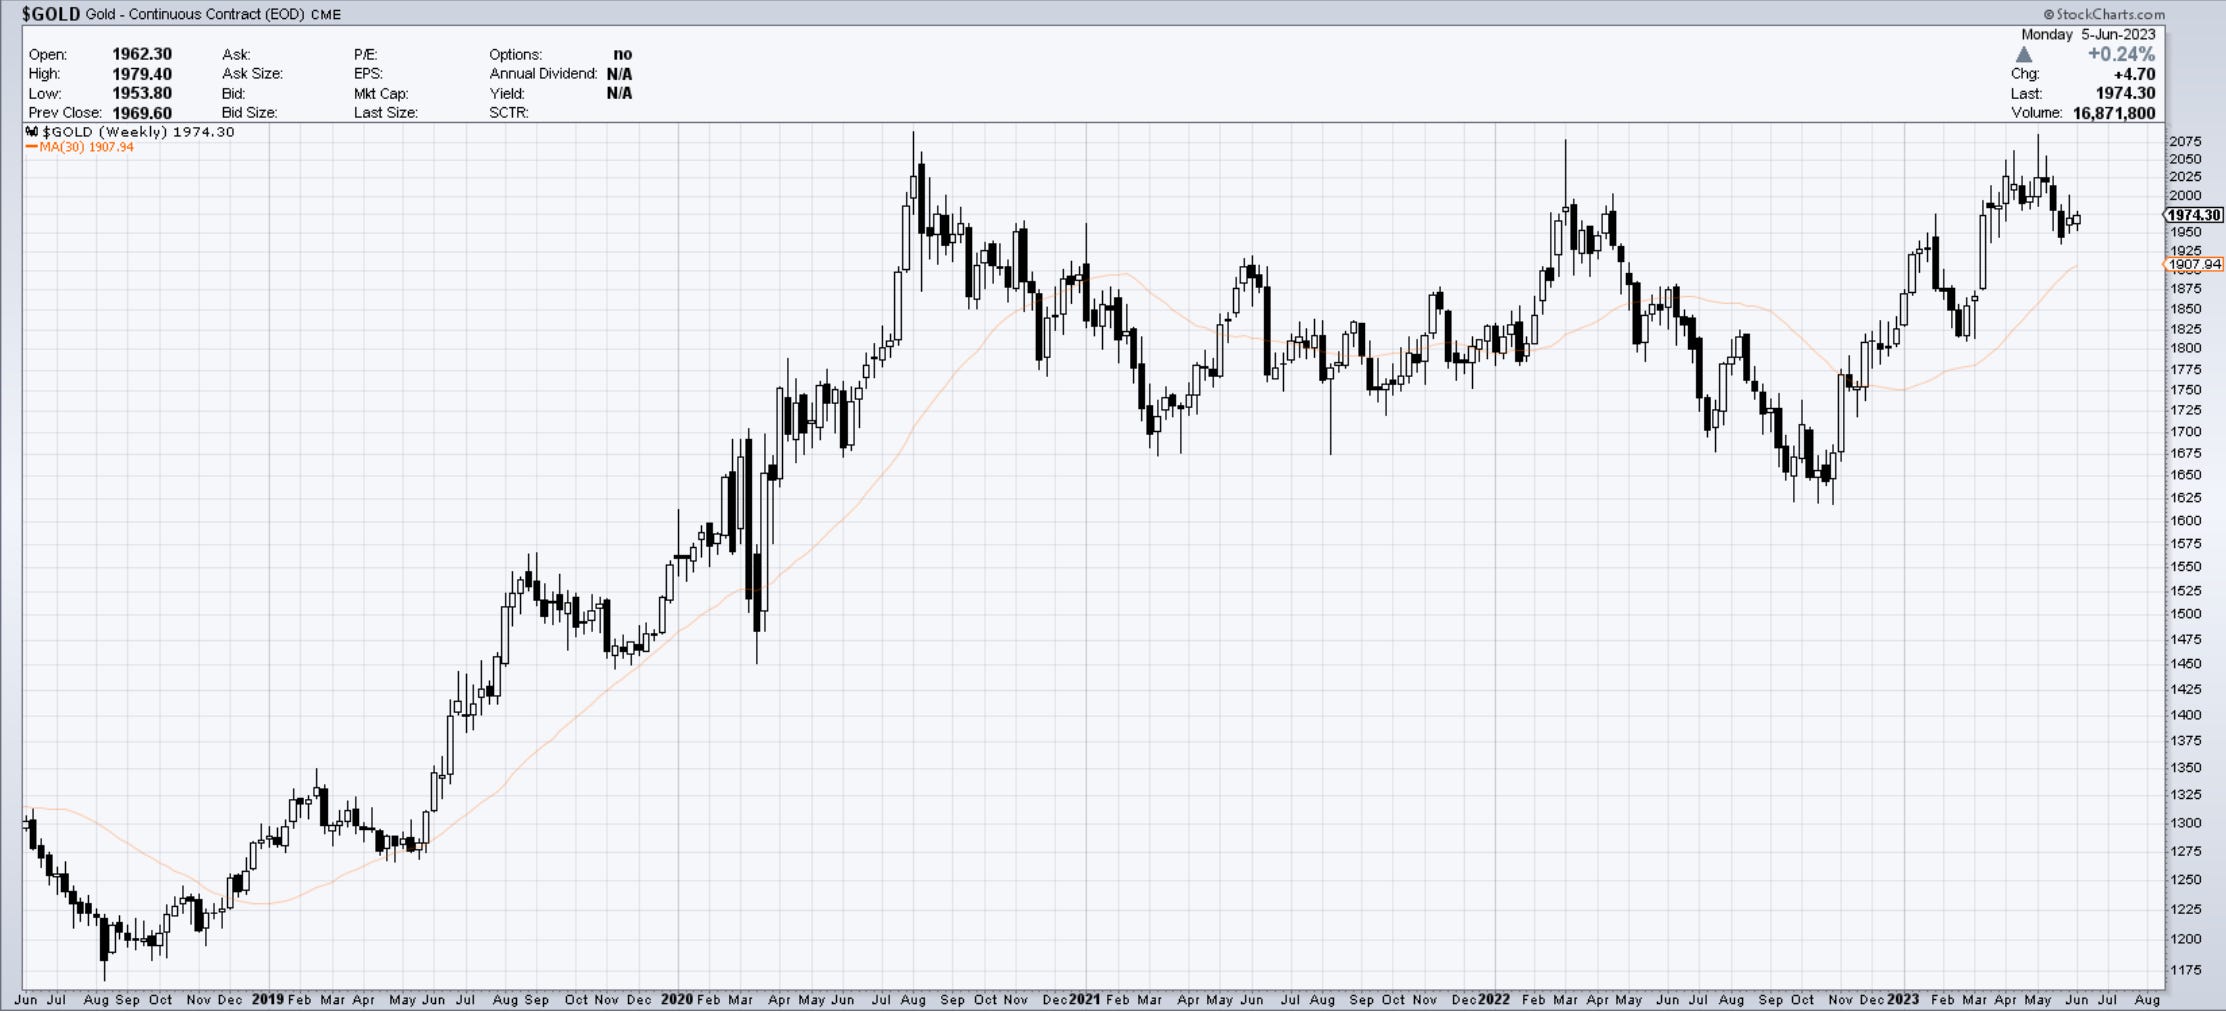
Gold has trouble getting above 2075.
Cris
email: ewcafe@pm.me