
A big Truth about market's last 4 months
Markets review, strategy and analysis

Early December is when I started noticing the market not acting in line with previous uptrends. Sure the climb higher has slowly continued but something has changed in the way it was happening.
Previous large performers like NVDA and PLTR have stopped going up. NFLX broke heavily and MSFT did not look healthy. AAPL is not far behind in acting bad. GOOGL is the only one that seems to defy gravity but how long will that last?
As traders we all watch charts but do we actually watch price action? A quick glance at a chart will tell us , this is going up or this is going down. But do we really look at how that’s really happening? What do I mean by that?
Behind every tick in the market there should be buyers and sellers right? That’s what causes prices to move up and down on the chart. But then I ask myself, ok if the market is open 9.30am to 4pm that’s where the buying and selling is happening in large part with the biggest orders and biggest liquidity.
That’s when everyone is at the party and most shares exchange hands. So if a stock opens at $100/share, during the day it can go to $99 , $98 then $100 and maybe even $102, back again and up again and maybe closes to $103/share.
But then shares stop trading or maybe trade a bit in lower liquidity after the market is closed for a couple of hours. Then it starts getting some interest depending on the name early in the morning with couple of hours before everyone comes in to work. That action pushes the price to 104. Then some news hit that stock an hour before market open and stock trades 107. Now some traders don’t trade in premarket or don’t have access to that. So they come in 8.30 and see stock at 107 from 103. Wow. Bullish right? Let’s buy it. Then it spikes to 110 once market opens only to drift lower over the course of the day back to 105.
Now if you look at the candle you will see a bullish close and everyone on CNBC will say, wow stock ABC has really moved from 103 to 105 a good gain on a bullish stock. But what really has happened? Stock gapped from the previous day close of 103 to 107 open, made a 110 high and closed the day at 105. Was it a bullish day or a bearish day?
Welcome to Wall Street. You just got scammed. Stock lost $2. It opened at 107 and closed at 105. So what really happened during the day when everyone is playing and exchanging shares on large volume? The stock was sold. How is that possible?
It is possible because market makers and exchanges, those responsible for matching buyers and sellers, told us that demand matched supply perfectly at 107. But see , there was no buying and selling to make that happen, only orders in the books. This “arbitrary” number is where the exchanges are saying the “fair” price is. But that happens when most people are sleeping, there is not enough liquidity for doing large transactions yet a price is being established by so called orders in the books premarket.
But then, when the real liquidity comes in, stock gets sold and closed $2 dollars lower then where it opened. Well who sold this? Someone that wanted to unload their shares and traders that maybe got trapped buying the 110 spike.
Now if this gets repeated for like 30days, the stock might appear that it advanced 15% in total price but overall it actually lost gains from open to close. Tricky hey? Now if we add all those days where it lost during the day we come up with -10%. What??? So then how did the stock gain 15%? Well that’s because 10% of that entire move was created due to GAPS while you were sleeping. Only 5% is responsible for the actual buying in the stock , the rest of 10% is due to gaps. So in reality there is a froth there of 10% where there was no real buying. Makes sense?
A stock that behaves like that its always in danger and soon will get hit by reality. There is no real buying. The real intraday selling will prove to be the real move. Unloading.
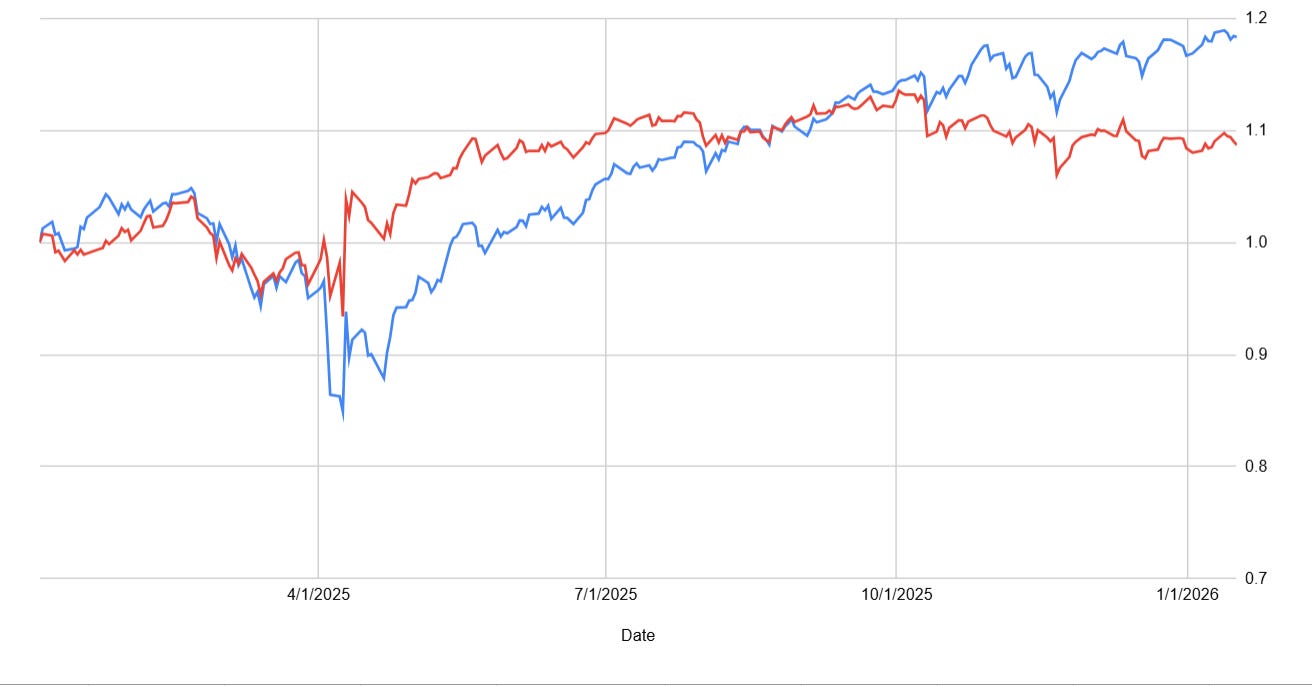
Now let me show you couple of charts.
Below is the SP500. The blue line is what everyone sees on their charts and the red line is what happens only when the market is open. Take a look.
Below is the Nasdaq100.
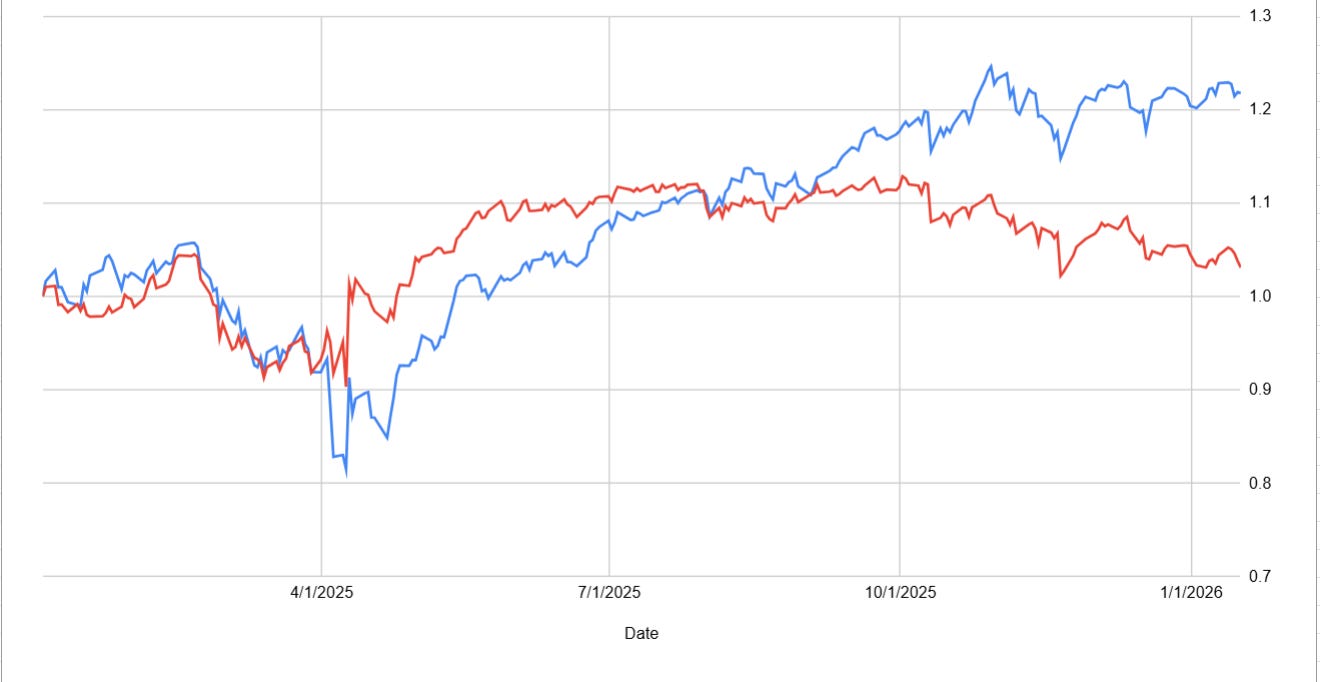
And this is how Wall Street hides their real moves. Pure price action.
Cris.
If you’re new to Elliott Wave or need to refresh, there is a 7-hour video course with downloadable slides under EW Course tab on the website.
You can find it HERE.
Cris,
EWCafe